
Fig. 1.
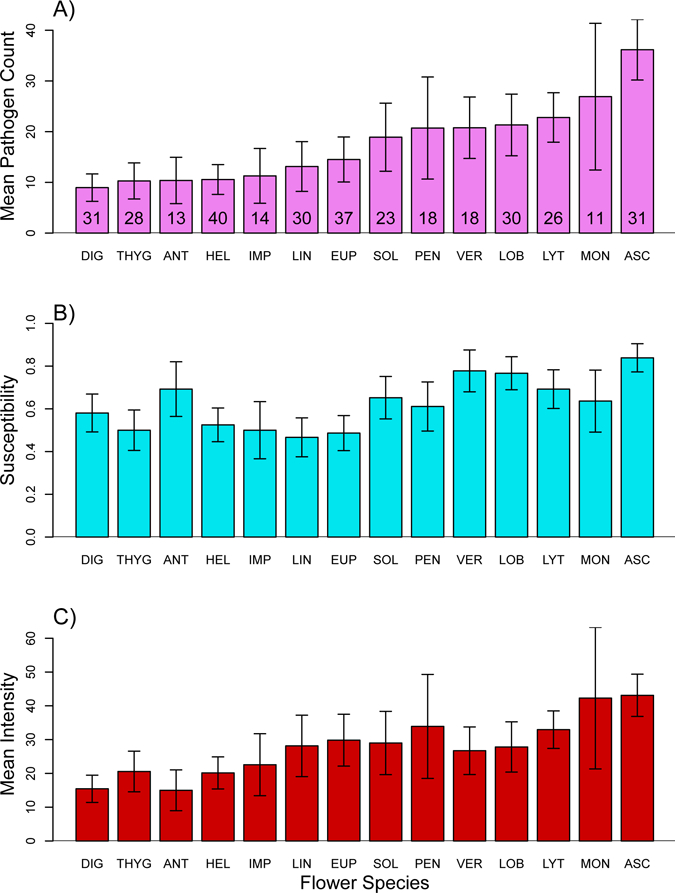
A) Mean Crithidia cell count (in a 2 μl sample) of bees foraging at different plant species provided with the same inoculum, including both zero and positive counts (mean abundance). Error bars are ±1 s.e.m.; numbers in bars are the sample size. Species acronyms begin with the first three letters of the genus. B) Susceptibility, the fraction of trials on each plant species for which the pathogen count was positive. Error bars are binomial standard errors on the fraction of positive counts. C) Mean intensity, the mean of positive cell counts. Error bars are ±1 s.e.m. Figure generated by R script SusceptibilityAndIntensityPlots.R; Dryad repository.