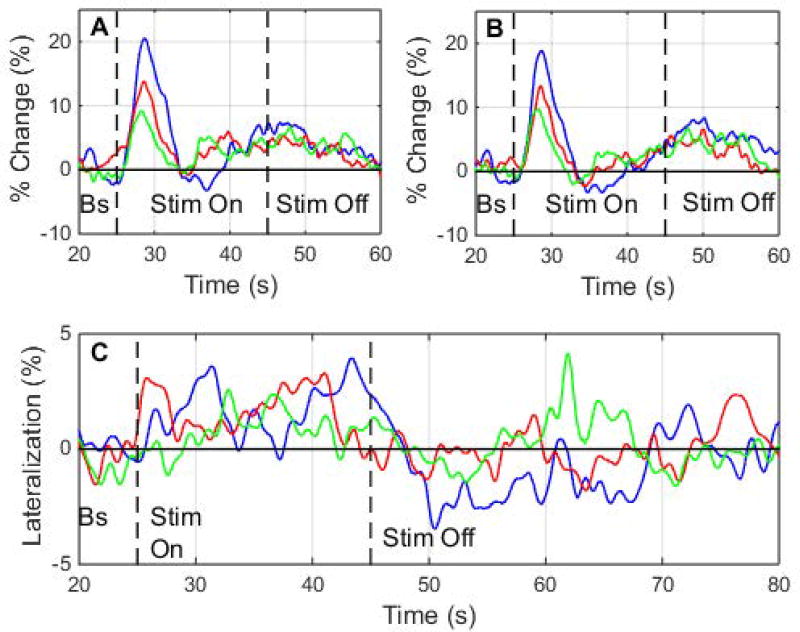
Fig. 3. Adaptation vs. Time in Envelope Velocity and Lateralization.
Plot of ensemble average envelope velocity percent change versus time for each trial, showing adaptation occurring between trials, for the (A) left side and (B) right side. (C) Plot of lateralization versus time for each trial. Error bars not shown for clarity. Bs = baseline, Stim = stimulus.

