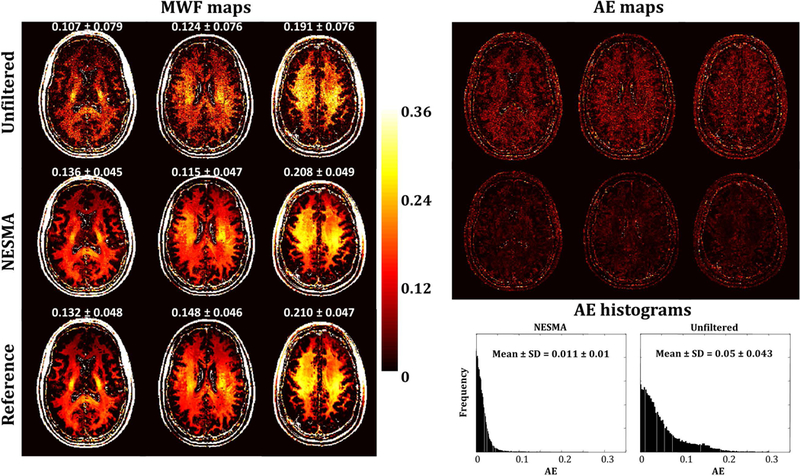
Figure 4.

Myelin water fraction (MWF) maps, absolute error (AE) maps, and AE histograms derived from unfiltered and NESMA-filtered simulated GRASE images. Mean and standard deviation (SD) MWF values were calculated over a large region laying within white matter and are reported above each slice. AE histograms and mean and SD AE values were obtained from large white matter regions over the entire imaged volume. As is readily seen, derived MWF maps from NESMA-filtered images exhibited more consistency and less variation with lower AE than those derived from unfiltered images. Further, mean and SD MWF values derived from NESMA-filtered images were very close to the reference values derived from noiseless images. In contrast, mean MWF values derived from unfiltered images were systematically underestimated and exhibited larger SD. These results are in good agreement with the in vivo results (Figs. 1, 2 and 4). Finally, as expected, AE histograms indicate that MWF estimates from unfiltered images exhibit larger dispersion than those derived from NESMA-filtered images.
