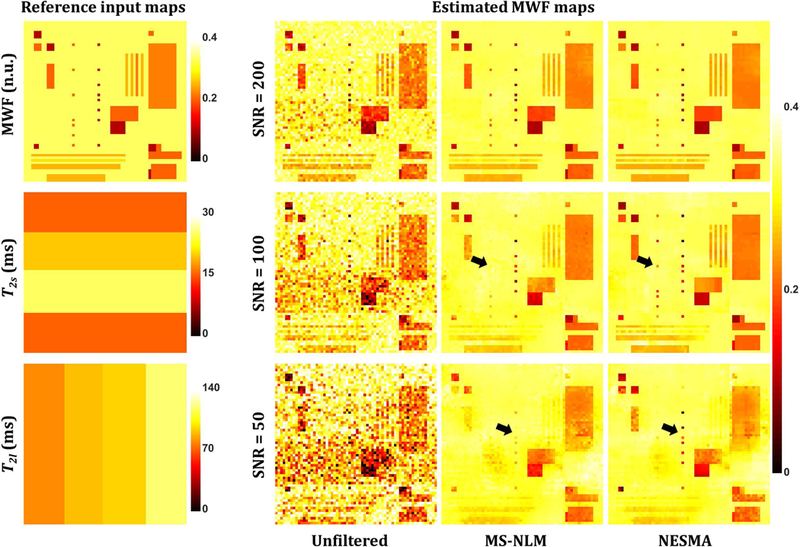
Figure 5.

Left-hand panel: myelin water fraction (MWF), T2s, and T2l reference images used as inputs to evaluate filter performance. These reference images were derived from a simulated sequence of noise-free 3D T2-weighted images generated at 32 TEs, linearly spaced between 10 ms and 320 ms, assuming a biexponential signal model that incorporates myelin and intra/extra-cellular water peaks. Gaussian noise was added to produce images with signal-to-noise ratio (SNR) of 200, corresponding to an in vivo value,27,29 as well as 100 and 50, as may result from implementation of high-resolution fast imaging. Right-hand panel: Estimated MWF maps derived from unfiltered images or from images filtered using multi-spectral nonlocal means (MS-NLM) and NESMA, obtained as described in the text. Black arrows indicate example of regions where NESMA shows higher performance than MS-NLM.
