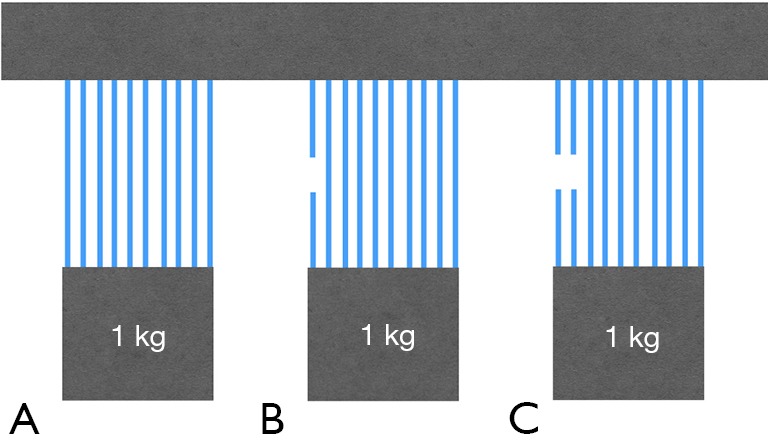
Figure 2.

Graphical representation of Mead’s model (61). When a load (1 kg in this example) is imposed to elastic fibers, the load is equally distributed among them (A), When a fiber does not provide its contribution, a higher load is imposed to the remaining fibers (1.11 for each of the 9 fibers) (B). For the 8 remaining fibers, the load is 1.25 and so on (C).
