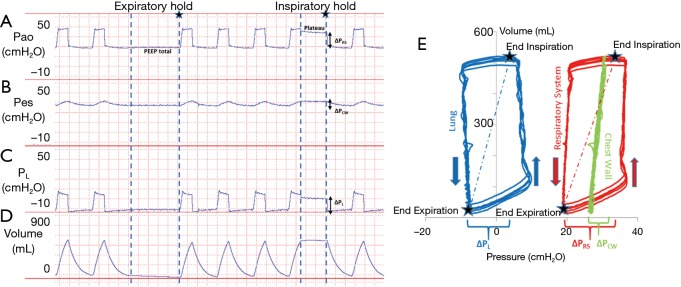
Figure 1.
Pressure and volume tracings from a patient with elevated pleural pressures. (A) Airway pressure (PAO) measuring total respiratory system pressure. End-inspiratory hold pressure (plateau) and end-expiratory pressure hold (PEEPtotal) are shown. Respiratory system driving pressure (∆PRS) was calculated as the plateau pressure minus the PEEPtotal; (B) esophageal pressure (PES) estimates the trans-chest wall pressure. Chest wall driving pressure (∆PCW) was calculated as the end-inspiratory hold PES minus end-expiratory hold PES; (C) transpulmonary pressure (PL) was calculated as PAO minus PES. Transpulmonary driving pressure (∆PL) also known as the cyclical stress was calculated as the end-inspiratory hold PL minus the end-expiratory hold PL; (D) lung volumes during tidal breathing and during expiratory and inspiratory holds; (E) pressure-volume (P-V) curves during tidal breathing with P-V measurements following respiratory system pressures (PAO), transpulmonary pressures (PL), and chest wall pressures (PES). Dotted lines represent the static compliance of the respiratory system and lung as measured by the slope between end-inspiratory holds and end-expiratory holds (stars on the graphs). Arrows indicate the direction of the inspiration and expiration.

