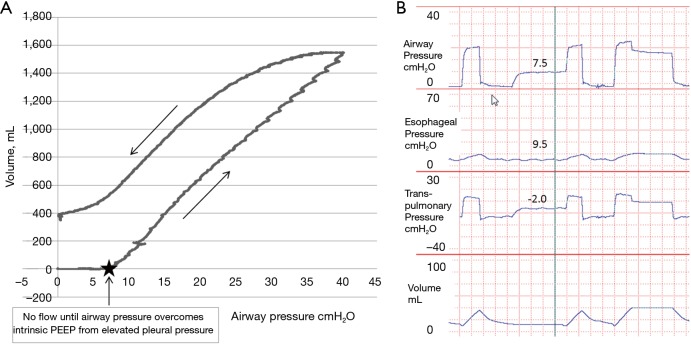
Figure 2.
Slow flow pressure-volume loops and time tracings from a study patient with acute respiratory distress syndrome. (A) Pressure-volume loop of study patient. There was no flow or volume increase until roughly 7.5 cmH2O airway pressure. In order to generate flow, the airway opening pressure must be greater than the pressure within the lungs which appears to be roughly 7–7.5 cmH2O. This pressure within the lungs appears to be secondary to elevated pleural pressures; (B) in the same patient wave forms were recorded with zero PEEP which shows that during end-expiratory occlusion, the PEEPi is roughly 7.5 cmH2O, secondary to elevated esophageal pressure of roughly 9.5 cmH2O causing airway collapse. Patient had normal lungs at baseline without COPD or asthma with normal resistance.

