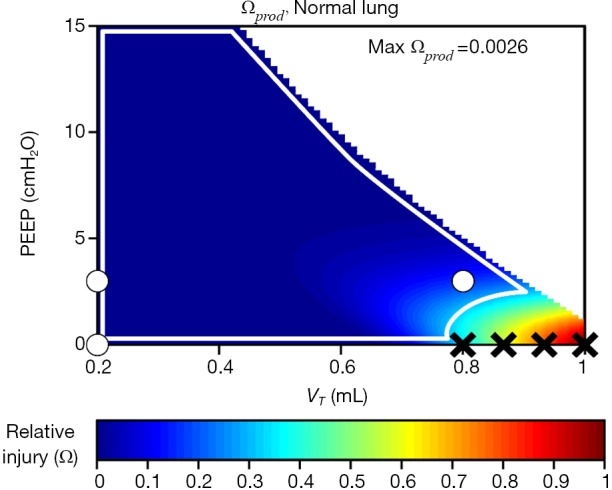
Figure 6.

Predicted lung injury cost function for an initially healthy mouse consisting of the product of volutrauma and atelectrauma. Black ‘X’ indicates in vivo experiments that produced lung injury, white circles demarcate in vivo experiments that were non-injurious. The white line describes a ‘safe region’ of ventilation. Adapted from Hamlington et al. (92).
