Fig. 1.
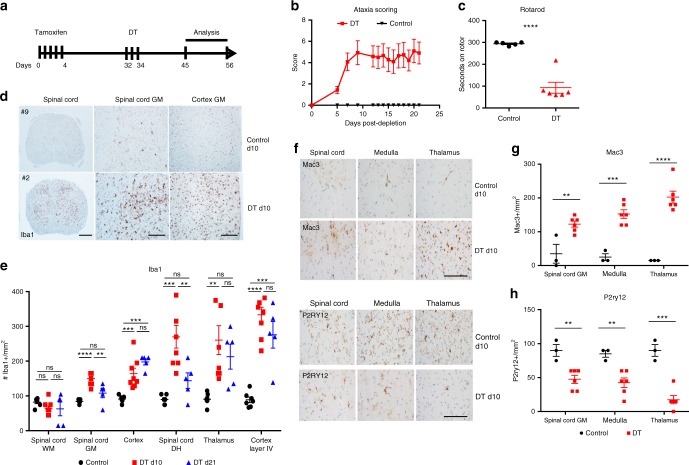
Microglia depletion triggers ataxia and gray matter microgliosis. a Schematic outline of TAM and DT treatment strategy to study impact of microglia depletion on neuroinflammation. Microglia-depleted mice (red) exhibited b severe ataxia behavior scores compared to littermate control mice (black). c Dot plot depicts the seconds on rotarod of mice at d10 post depletion (red) and littermate controls (black). d Representative images of Iba1 immunohistochemical staining in spinal cord and somatosensory cortex at d1 post depletion and control animals. Scale bar for spinal cord left column = 200 μm and scale bar for middle and right column = 100 μm. e Dot plots depict the average number of Iba1+ cells per mm2 quantified in control (black), d10 post microglia depletion (red) and d21 post microglia depletion (blue) in spinal cord gray matter (GM), spinal cord white matter (WM), the frontal cortex and the somatosensory system, including the dorsal horn of the spinal cord, the thalamus and the layer IV of the somatosensory cortex. Representative immunohistochemistry of the activation marker Mac3 (f) and the homeostatic microglia marker P2ry12 (h) in the gray matter of the spinal cord, medulla and thalamus from control and ataxic mice at day 10 post depletion, scale bar = 100 μm. Dot plots depict the average number of Mac3+ (g) and P2ry12+ (i) cells per mm2 quantified in control (black) and d10 post microglia depletion (red). Representative experiment of three independent experiments. Error bars depict SEM and n = 3–7 mice per group. e Analyzed by one-way ANOVA with Tukey’ post-hoc test for multiple comparisons and g, i analyzed with Student’s unpaired t-test at 95% confidence interval and ****p < 0.0001, ***p < 0.001, **p < 0.01, ns not significant

