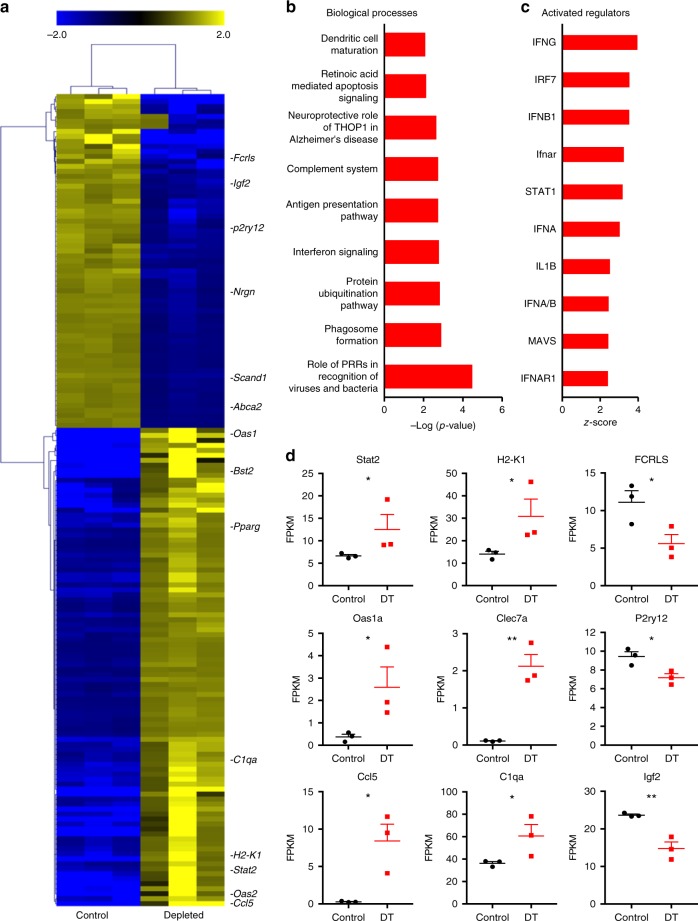
Fig. 3.
Type 1 interferon inflammatory signature associated with acute neurodegeneration. a Heatmap depicts hierarchical clustering of upregulated (yellow) and downregulated (blue) genes in cortical tissue from d10 microglia-depleted mice identified by DeSEQ2 analysis of TMM normalized RNA-Seq values. b, c Bar graphs depict Ingenuity pathway analysis of the 10 most significant biological processes and predicted upstream regulators of the DE genes in the dataset. d Dot plots demonstrate the FPKM (fragments per kilobase million) values in cortical tissue from control (black) and depletion (red). Cortical tissue from ataxic mice demonstrated upregulation of type 1 interferon pathway genes and genes associated with microglia activation, and lower expression of genes associated with a neuronal and microglia homeostasis. Error bars depict SEM and n = 3 mice per group. Analyzed with Student’s unpaired t-test at 95% confidence interval and *p < 0.05, **p < 0.01

