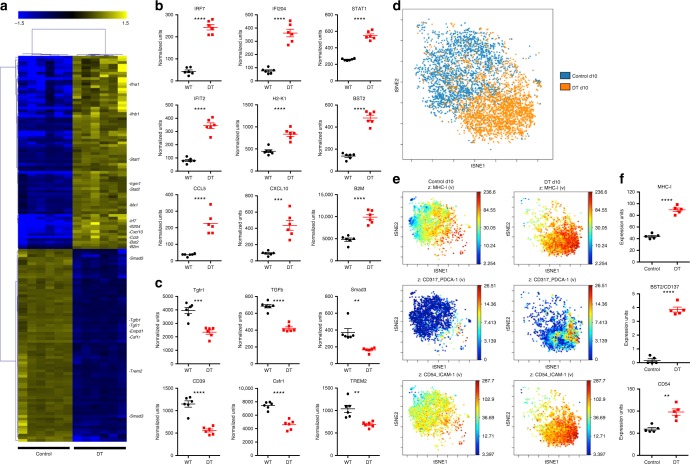
Fig. 4.
Loss of homeostatic microglia after depletion. CD11b+CD45intCX3CR1-GFP+Ly6C– microglia were sorted from d10 control and d10 post microglia depletion mice and their transcriptome was analyzed using the Nanostring mouse immunology kit. a Heatmap depicts hierarchical clustering of significantly upregulated (yellow) and downregulated (blue) genes in microglia from six control and six d10 microglia-depleted mice. b, c Dot plots demonstrate the relative expression levels in wild-type control (black bars) and d10 post depletion microglia (red bars). b Microglia from ataxic mice demonstrated upregulation of type 1 interferon pathway genes: IRF7, Ifi204, Stat2, Ifit2, H2-K1, B2M, BST2, CCL5, CXCL10. c Microglia from ataxic mice demonstrated lower expression of genes associated with a homeostatic microglia signature TGFb, Tgfr1, Smad3, CD39 (Entpd1), Csfr1 and Trem2. To assess the activation state of repopulated microglia, control and d10 post depletion CX3CR1-GFP+CD45intCD11b+Ly6C– microglia were analyzed by CyTOF. d ViSNE analysis of control and repopulated microglia demonstrated that repopulated microglia cluster differently than controls, indicating a unique activation state of these cells. e Expression of MHCI, CD137/BST2 and CD54 in control and repopulated microglia clusters. f Dot plots depict quantification of CyTOF expression units for MHCI, CD137/BST2 and CD54 in control (black) and d10 post depletion microglia (red). Representative experiment of two independent experiments. Error bars depict SEM and n = 5–7 mice per group. Analyzed with Student’s unpaired t-test at 95% confidence interval and ****p < 0.0001, ***p < 0.001, **p < 0.01

