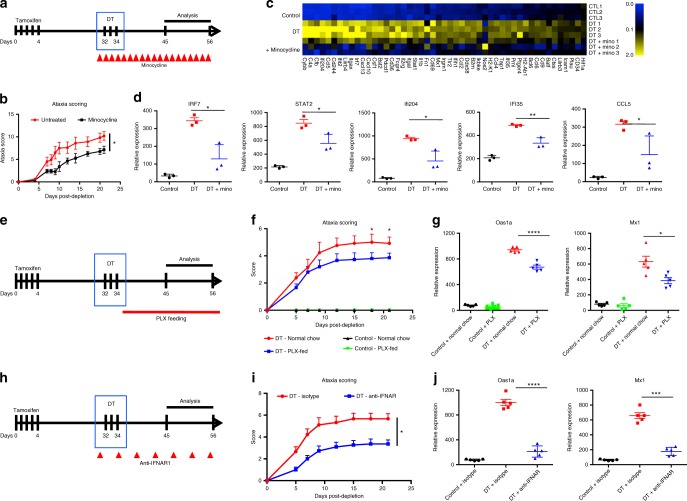
Fig. 5.
Blunting type 1 interferon-mediated neuroinflammation reverses effects of microglia ablation. a Schematic of minocycline treatment to blunt neuroinflammation in microglia-depleted mice. b Ataxia behavior scoring of microglia-depleted mice (red) and minocycline-treated mice (black). c Heatmap depicts upregulated (yellow) and downregulated (blue) genes in microglia from control, d10 microglia-depleted and d10 microglia-depleted mice treated with minocycline analyzed with Nanostring immunology chip. d Dot plots demonstrate the relative expression levels in wild-type control (black), d10 post depletion microglia (red) and d10 microglia-depleted mice treated with minocycline (blue). e Schematic of PLX5562 feeding to prevent microglia repopulation in DT-ablated mice. f Ataxia clinical scoring of DT mice treated with isotype control (red) or anti-IFNAR1 antibody (blue). g Dot plots demonstrate the relative expression levels of the Oas1a and Mx1 in cortical tissue from non-depleted control mice fed control chow (black), control mice fed PLX5562 chow (green), d10 post depletion fed normal chow (red) and d10 post depletion fed PLX chow (blue). h Schematic of anti-IFNAR1 treatment to blunt type 1 interferon signaling in DT-ablated mice. i Ataxia clinical scoring of DT mice treated with isotype control (red) or anti-IFNAR1 treated mice (blue). j Dot plots demonstrate the relative expression levels of the Oas1a and Mx1 in cortical tissue from control (black), d10+ isotype control post depletion (red) and d10 post depletion+anti-IFNAR1 (blue). Representative experiment of two independent experiments. Error bars represent SEM, n = 3–5 mice per experiment and dot plots analyzed with unpaired t-test at 95% confidence interval, ****p < 0.0001, ***p < 0.001, **p < 0.01, *p < 0.05

