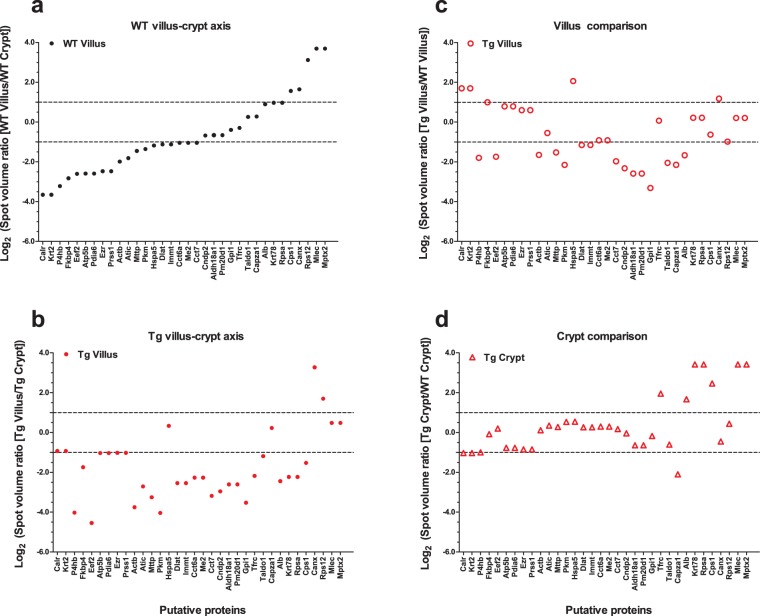
Figure 3.
Distribution of differentially expressed proteins is altered in CD98 overexpressing mice. Putative proteins from 32 spots were identified using LC-MS and were considered differentially expressed if the level fold change is ≥2. Collectively from all four comparisons, 34 different putative proteins (labeled in figure as genes responsible for encoding them) were identified where, among the repeats, only the putative protein with the highest score is included. Putative proteins in the villus of WT (a) and Tg (b) were compared to its respective crypt to determine their distribution profile along the axis. Cross-comparison between the genotypes were also made between the villi of WT and Tg (c) and between the crypt of WT and Tg (d). Dotted lines indicate the threshold for 2 fold change. Upper = (+) 2-fold change; Lower = (−) 2-fold change. Plots between the threshold lines indicate proteins with less than 2 fold change, thus a minimal expression difference, for the comparison. Y-axis is in Log2 (Spot volume ratio) scale.

