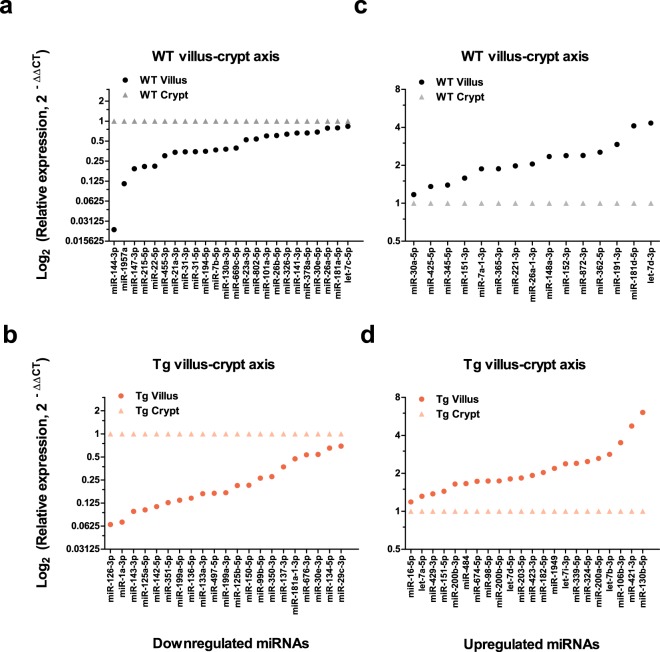
Figure 5.
Expression levels of certain miRNAs are uniquely affected by the overexpression of CD98 in IECs. Relative fold change (2−∆∆CT) of miRNAs differentially affected by CD98 overexpression is shown. All miRNAs listed were found to be differentially expressed using a cutoff p-value of < 0.05. These miRNAs expression are unique to the axis of either genotype. In WT, 24 miRNAs were downregulated (a) and 15 miRNAs were upregulated (c) in the villus compared to its crypt. In Tg villus-crypt axis, 21 miRNAs were downregulated (b) and 22 miRNAs were upregulated (d) in the villus compared to its crypt. Y-axis is shown in Log2 (Relative expression) scale.

