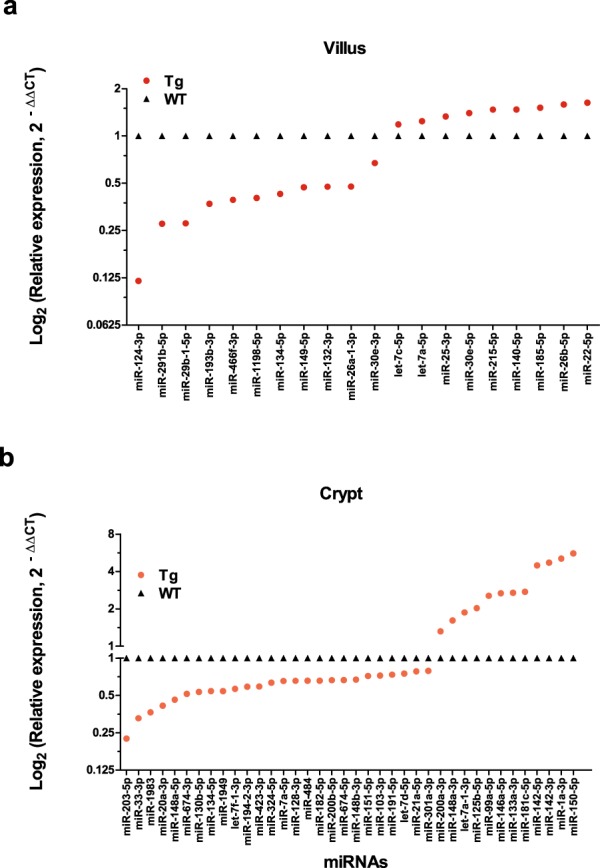
Figure 6.

Villus and crypt harbor unique miRNA expression profile which is altered by CD98 overexpression. Relative fold change (2−∆∆CT) of miRNAs detected in either villus or crypt of WT and CD98 Tg ileal IECs is shown. To determine if there was a regional variation in miRNA expression profile due to genotypic difference, Tg villi were compared with WT villi (a) and Tg crypt were compared with WT crypt (b). Of the 58 miRNAs identified from these comparisons, with the exclusion of miR-134-5p, -19 and -37, miRNA profile signature is unique to the villus or crypt. Y-axis is shown in Log2 (Relative expression) scale.
