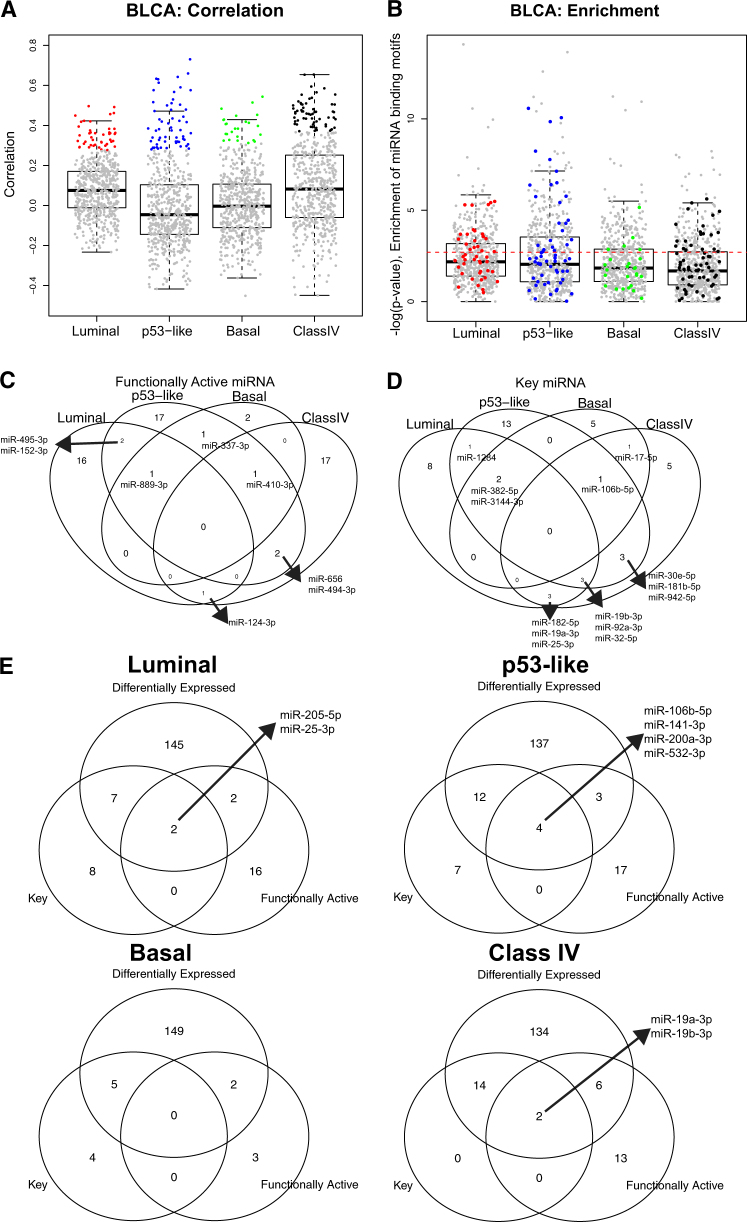
Fig. 2.
Functionally active and key miRNAs for each subtype. a Pearson correlation between expression of miRNA and the inferred activity of miRNAs for each subtype. Boxplot of correlation between inferred activity and expression of miRNAs are shown. The miRNAs with significantly strong correlation at FDR 5% are colored for each subtype. b –log(p value) of enrichment for miRNA-binding motifs among genes whose expression levels are correlated with each miRNA activity levels. The miRNAs with significantly strong correlation at FDR 5% are colored for each subtype. The colored miRNA whose enrichment is significant at FDR 5% are defined as the functionally active miRNA. c The number of functionally active miRNA for each subtype. d The number of key miRNAs for each subtype. The key miRNA is defined as the miRNAs whose activity is significantly correlated with a large number of targets’ expression levels. e Venn diagram for differentially expressed, key, and functionally active miRNAs for each subtype

