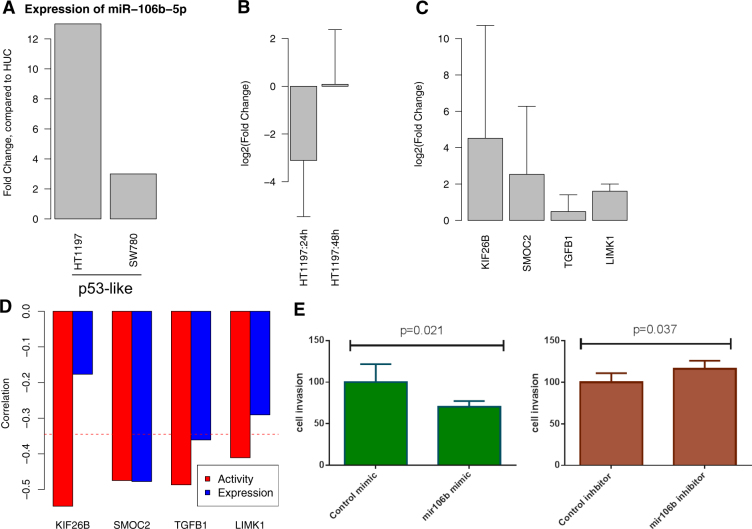
Fig. 5.
Experimental validations of miR-106b-5p. a Expression levels of miR-106b-5p for each cell line. Fold changes compared with HUC are shown for each cell line. b log2 transformed fold changes after treatment of miR-106b-5p-specific anti-miR inhibitor after 24 and 48 h. c The expression changes of target genes after inhibition of miR-106b-5p expression. Comparison of qPCR results of the control and miR-106b-5p inhibitor confirmed that miR-106b-5p regulated the gene expression levels of its predicted target genes. d The Pearson correlation between target genes of each miRNAs and miRNA expression (blue) or miRNA activity (red). Even through the expression level of miR-106b-5p did not correlated with the expression levels of their target genes KIF26B and LIMK1, the inferred miRNA activities of miR-106b-5p significantly correlated with the expression levels of KIF26B and LIMK1. e Cell invasiveness was measured when overexpressing or knockdown miR-106b-5p with the miR-106b-5p-specific mimic or inhibitor relative to corresponding controls in HT1197. The miR-106b-5p-specific inhibitor significantly increased cell invasiveness (p = 0.037), whereas the miR-106b-5p-specific mimic significantly decreased cell invasiveness (p = 0.021). All error bars indicate 95% confidence Interval

