Fig. 5.
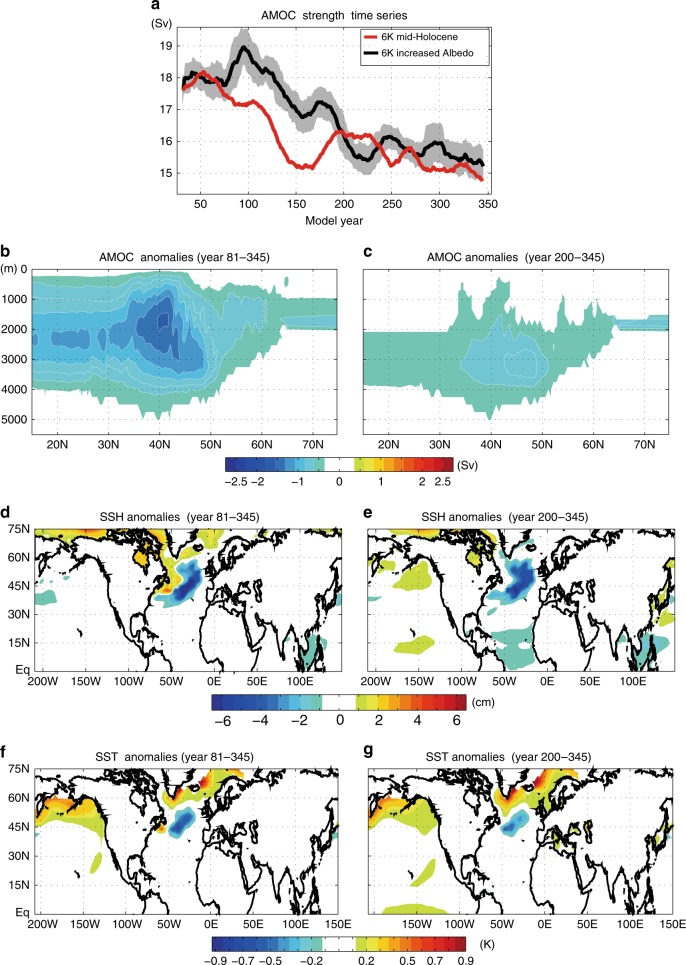
The response of Atlantic meridional overturning circulation to Arctic sea ice loss. a The 20-year running averages of AMOC strength, defined as the North Atlantic meridional streamfunction (Sv) averaged between depths of 500 and 2500 m, for the mid-Holocene (red) and the mid-Holocene with pre-industrial sea ice (black) simulations. The gray shadings indicate the range of 1 standard deviation from the mean of the mid-Holocene with pre-industrial sea ice (black) simulations. The responses of b, c AMOC (Sv; 1 Sv = 106 m3 s−1), d, e SSH, and f, g SSTs to Arctic sea ice loss averaged over the model years of b, d, f 81– 345 and c, e, g 200–345. Panel f is identical to Fig. 4a. In b and c, the abscissa is latitude and the ordinate is depth (m). In b and c, only statistically significant values (p < 0.05) are shaded

