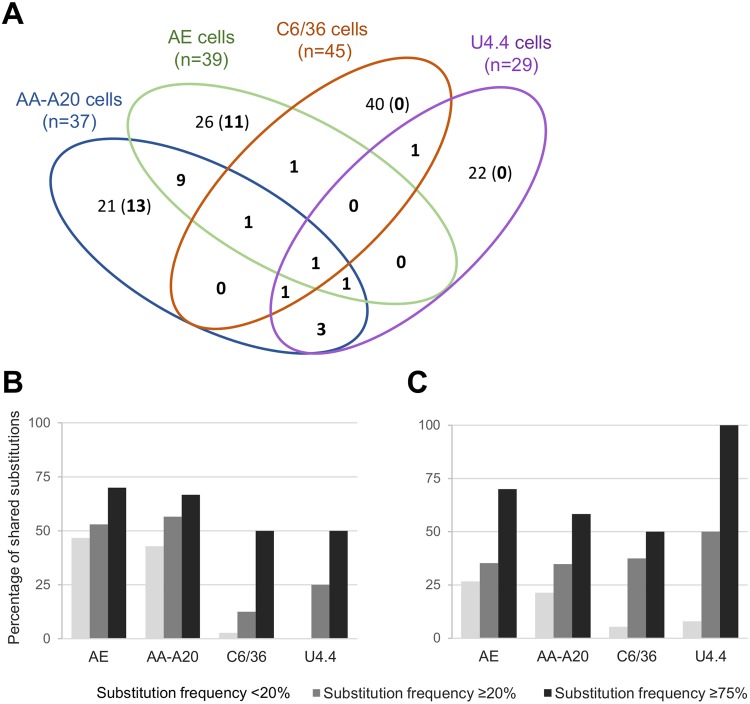
Figure 6.
Parallel evolution during serial passage in mosquito cells. (A) Venn diagram showing the repartition of the shared substitutions (in bold) during serial passage in mosquito cells. Each cell line is represented by an ellipse. Numbers in overlapping areas represent the number of substitutions found during passages in at least two different cell lines. Numbers in non-overlapping areas represent the number of substitutions found during passages in only one cell line (the number in bracket represents the number of shared substitutions shared in the same cell line). (B) Proportion of substitutions shared between viruses passaged in the same cell line. (C) Proportion of substitutions shared between viruses passaged in different cell lines (i.e. shared between at least two different cell lines). The maximum frequency was considered when one substitution was detected more than once.

