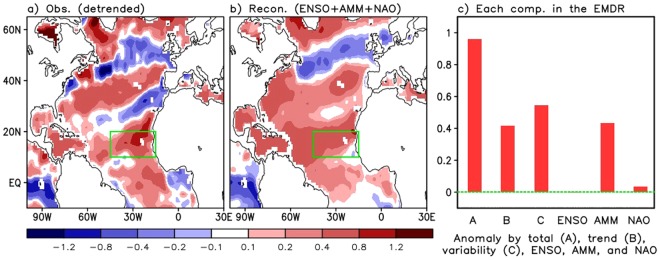
Figure 2.
Distribution of (a) the observed SST anomaly (detrended component) in August/September 2017 and (b) the reconstructed SST anomaly by combined impacts of the ENSO, the AMM, and the NAO. Green boxes denote the eastern Main Development Region (EMDR). (c) Six bars in the graph in the right panel represent the SST anomaly over the EMDR by total, long-term linear trend, climate variation (i.e., departure from long-term linear trend), ENSO impact, AMM impact, and the NAO impact, respectively.

