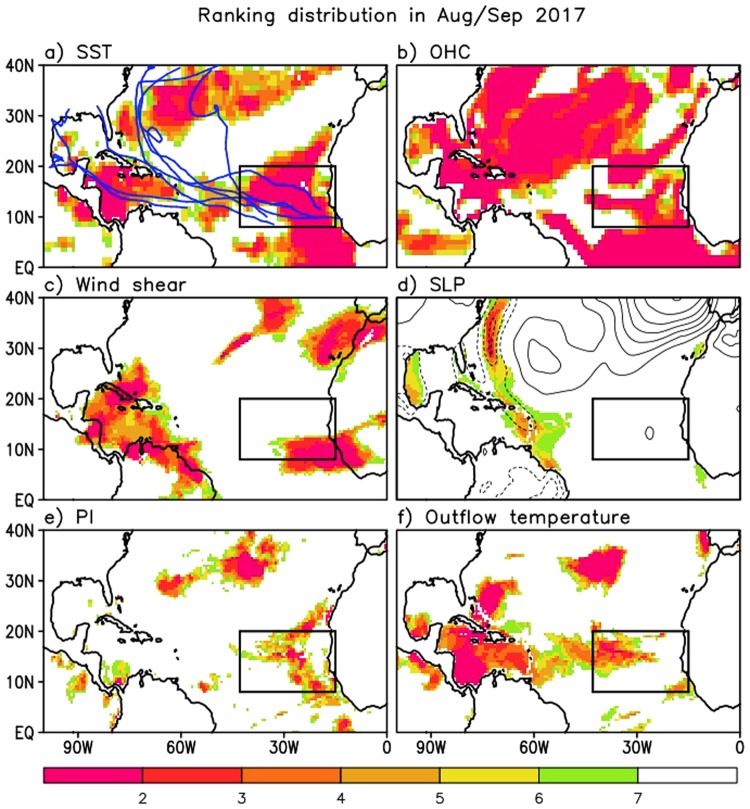
Figure 4.
Distribution of rankings corresponding to the anomalies of each key quantity during August/September 2017. Rankings are calculated over 1995–2017, the recent period of above-average tropical cyclone (TC) activity on decadal time scale. Ranking values are shaded only for the first top six rankings (1st – 6th). Key quantities investigated here, which play a crucial role in TC activity, are SST and ocean heat content (ocean impact), vertical wind shear and sea level pressure (dynamical impact), potential intensity and outflow temperature (thermodynamical impact). The blue lines in (a) are the TC tracks observed in August/September 2017. Contour lines in (d) represent the sea level pressure anomaly distribution. Black boxes denote the eastern Main Development Region (EMDR).

