Fig. 1.
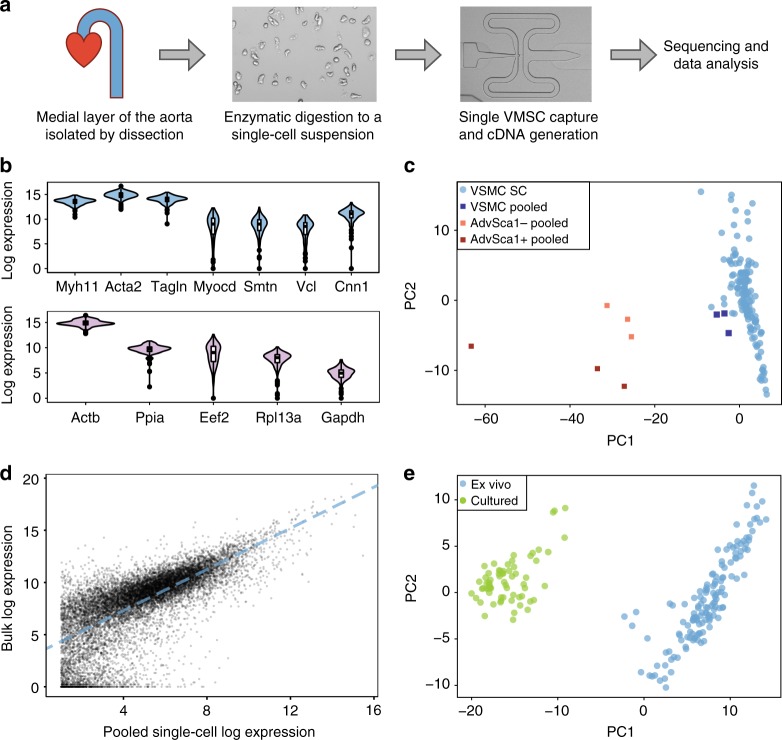
Single-cell RNA-seq analysis of vascular smooth muscle cells. a Schematic of the approach. Cells from the medial layer are enzymatically digested to obtain a single-cell suspension. Single-cell cDNA libraries are then generated, followed by sequencing and data analysis. b Violin plots showing the log2-transformed normalised expression of VSMC marker genes across the profiled 143 cells (top), as well as of housekeeping genes with similar mean expression levels (lower panel). c Mapping of single-cell VSMC transcriptomes (light blue), as well as transcriptomes from control VSMC (Sca1–, dark blue) and adventitial (Adv) cell (Sca1–, orange; Sca1+, red) samples (tube controls) on a two-dimensional PCA space. d Dot plot showing the log2-transformed read counts detected for each gene (black dots) when pooling across all single-cell samples versus the read counts detected with bulk RNA-seq. The dashed line shows a linear regression fit. e PCA plot summarising the single-cell expression profiles for ex vivo VSMCs (blue) and in vitro cultured VSMCs (green, data from Gene Expression Omnibus accession GSE79436, Adhikari et al.13)

