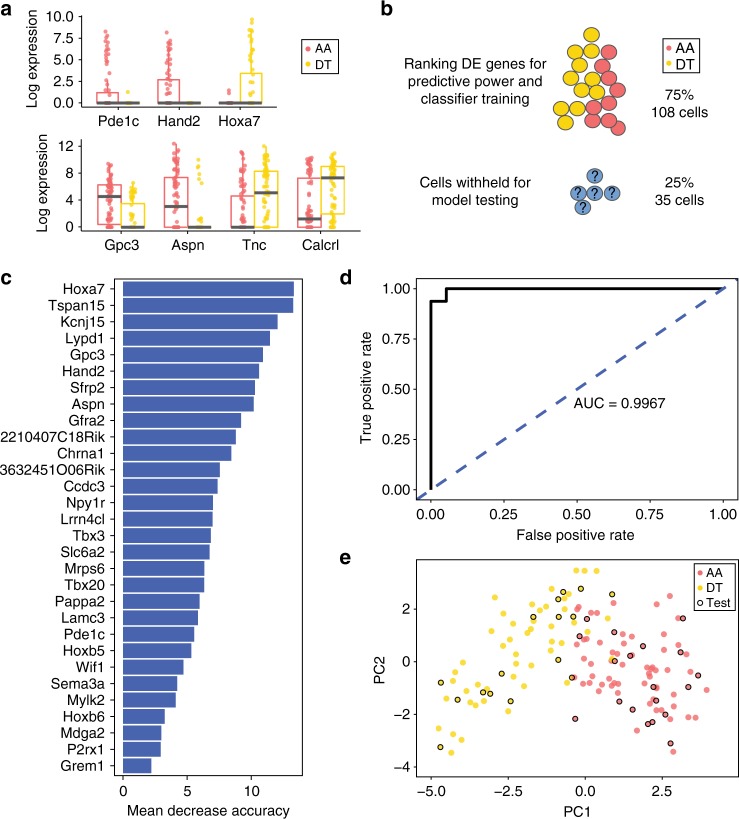
Fig. 3.
Single-VSMC transcriptomes reflect regional identity. a Boxplots showing log2-transformed normalised expression of genes detected as differentially expressed between the aortic arch (AA, red) and descending thoracic aorta (DT, yellow) in bulk RNA-seq experiments across single VSMCs. Top panel: genes showing expression near-exclusively in cells from one tissue. Lower panel: genes that are expressed in different proportions of cells from the AA and DT. Median (centre line), first and third quartiles (bounds of box) and 1.5 interquartile range (whiskers) and individual data points (dots) are indicated. b Schematic of the random forest analysis. The regional identity of 75% of the cells was used in classifier training and refinement. The remaining 25% of cells (35 cells) were tested with the model showing the best classification performance with the 75% subset. c The out-of-bag mean decrease in classification accuracy for the 30 genes used in the final classifier. d ROC curve showing the performance of the classifier on the 25% subset of cells that were not used for model testing and refinement. e PCA plot based on the 30 genes used in the final classifier, showing AA (red) and DT (yellow) cells. Cells in the 25% test subset are circled in black

