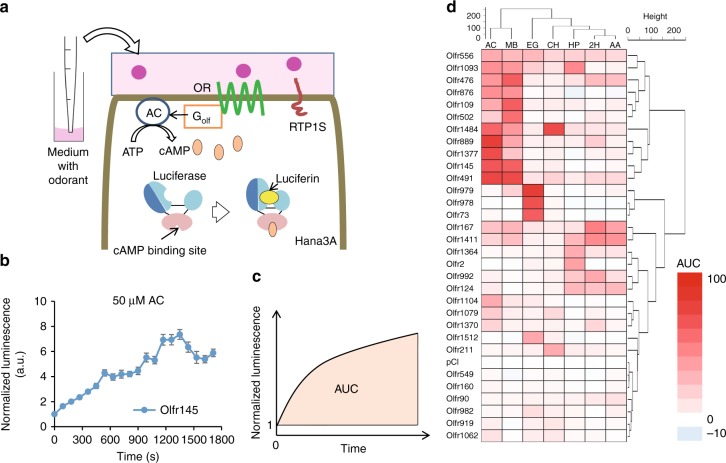
Fig. 2.
Liquid-phase odor stimulation with GloSensor assay system. a A schematic diagram of GloSensor assay in Hana3A showing OR signal transduction pathway. The GloSensor system use a modified luciferase with a cAMP binding domain so that luminescence activity depends on cAMP. b Real time measurement of each OR activation with 50 μM acetophenone. Error bars indicate s.e.m. (n = 3). c The image of area under the curve (AUC) analysis. Here, AUC indicates the sum of normalized luminescence from initial response to final response. d The heat map based on AUC with 50 μM acetophenone stimulation. The number on the left side indicate each OR and pCI (vector control) with a hierarchical clustering analysis. AC adenylyl cyclase, ATP adenosine triphosphate, cAMP cyclic monophosphate, RTP1S receptor transporting protein 1 short

