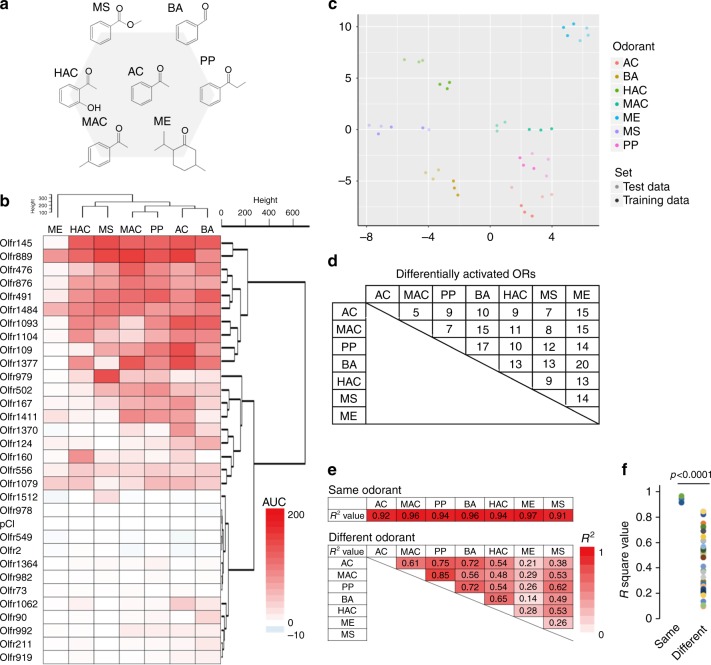
Fig. 6.
Differential activation of ORs with acetophenone analogs. a Chemical structures of each acetophenone analog used in this study. b Heat map showing AUC of each OR stimulated with odorants at 10–2 dilution. The number on the left side indicates each OR. c The 32-dimensional space (31 ORs and a vector control) visualized using t–SNE. Each point is an odor with color representing the odor presented and saturation representing whether the point was used to train the model or was part of the test set. d The number of ORs that are differentially activated by tested odorant (Tukey’s post hoc analysis, p < 0.05). e Summary of the discrimination analysis using the same or different odorant pairs. Each R2 value is shown in Supplementary Figures 20 and 21. f Difference of R2 values between results with the same odorant in different experiments and different odorants in the same experiment Student’s t-test. AC acetophenone, MAC 4-methyl acetophenone, BA benzaldehyde, PP propiophenone, HAC 2-hydroxyl acetophenone, MS methyl salicylate, ME menthone

