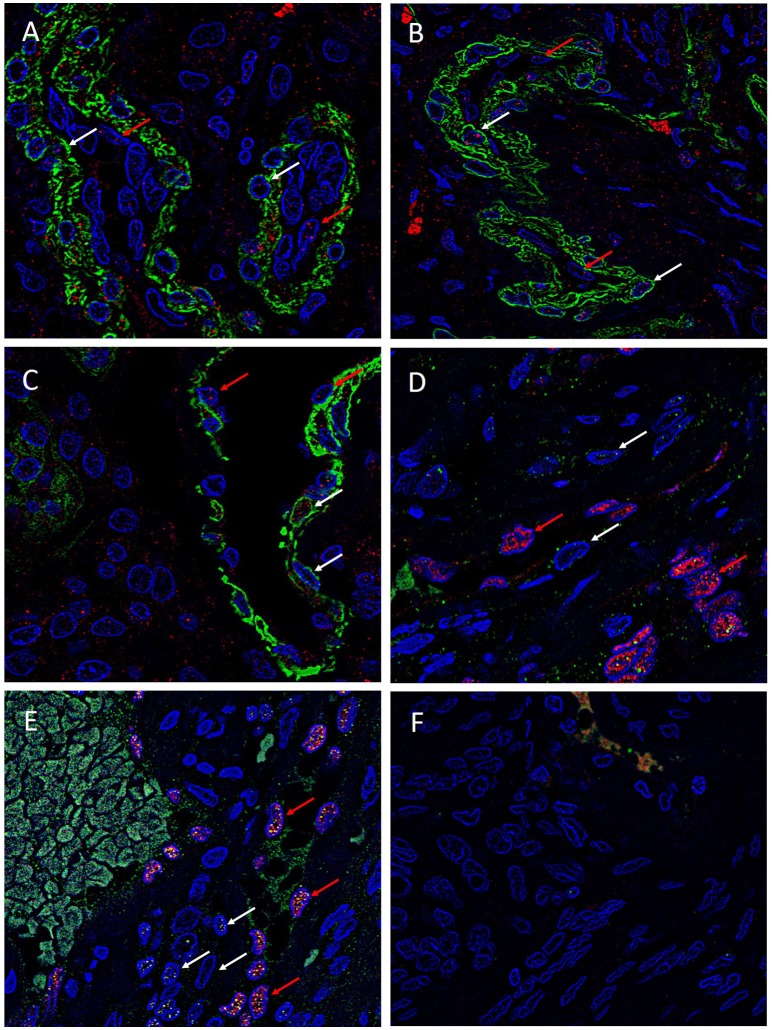
Figure 4.
Representative immonoflourescence immunohistochemical stained images of WHO grade I meningioma demonstrating the expression of SOX2 (A, red), NANOG (B, red), KLF4 (C, red), OCT4 (D, green) and c-MYC (E, green) on both the SMA+ (A–C, red, red arrows) pericyte layer, and the ERG+ endothelial layer (D,E, red, white arrows). Cell nuclei were counterstained with 4′, 6′-diamino-2-phenylindole (A–F), blue. Original magnification: 600X.

