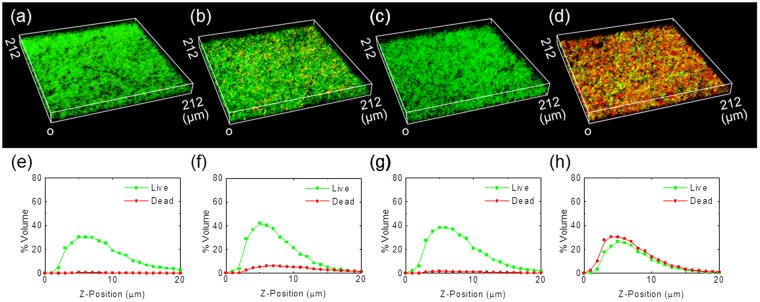
Figure 2.
CLSM images of S. mutans biofilms after treatment with zinc chloride and erythritol. Live (green) and dead (red) bacteria were imaged using CLSM (a–d). Biofilms treated with (a) DW, (b) zinc chloride, (c) erythritol and (d) a zinc-erythritol mixture for 10 min. The concentrations of zinc chloride and erythritol were 6.6 and 19.8 mM, respectively. The percentages of the volume occupied by live (green) and dead (red) bacteria was plotted (e–h). Data were quantified using image slices of z-stacks obtained from stained biofilms treated with (e) DW, (f) zinc chloride, (g) erythritol and (h) a zinc-erythritol mixture.

