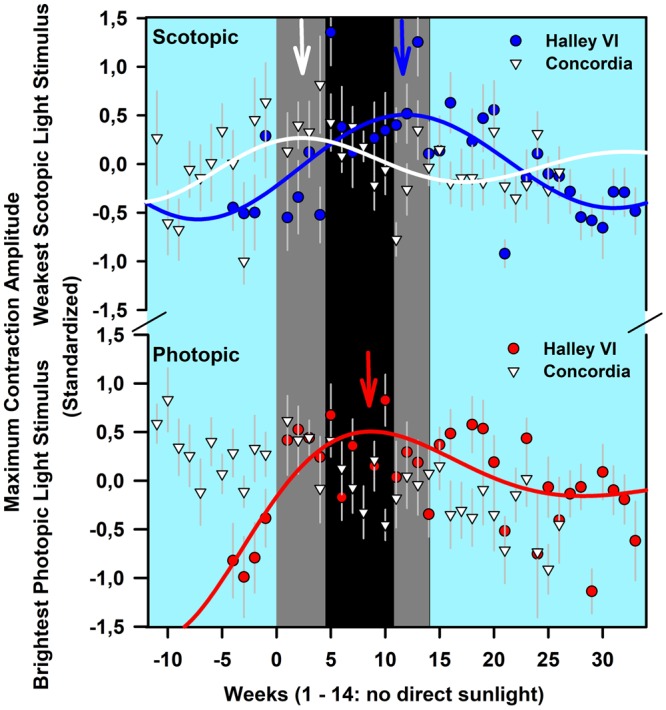
Figure 2.

Maximum contraction amplitudes on standardized data (z-scores) for all weeks for the weakest light stimulus (−4 log cd/m2) of the rod-weighted protocol (upper graph; please note two upper error bars from Halley VI are partly cut) and the brightest red light stimulus of the cone weighted protocol (2.6 log cd/m2; lower graph). Red and Blue filled circles depict averages for Halley VI and white filled triangles indicate results from Concordia. The arrows indicate the greatest maximum contraction amplitudes (see text for exact hours and R2-values). The first week from Halley VI was excluded because it contained only one participant. Otherwise, means per station ± SEM are shown. The solid lines indicate the regression line from nonlinear sine fits. For the cone-weighted protocol there was a linear association for the Concordia station (not shown). The cyan background indicates weeks with direct sunlight, and the dark background is the period without direct sunlight. Within this period without direct sunlight, the black background indicates complete absence of sunlight (nautical/astronomical twilight) and the dark gray background indicates civil twilight (see legend of Supplemental Fig. S1 for definitions of civil, nautical and astronomical twilight). The blue, red and white arrows at the top indicate the week with the maximum contraction amplitudes (derived from fitted lines; see text for exact numbers).
