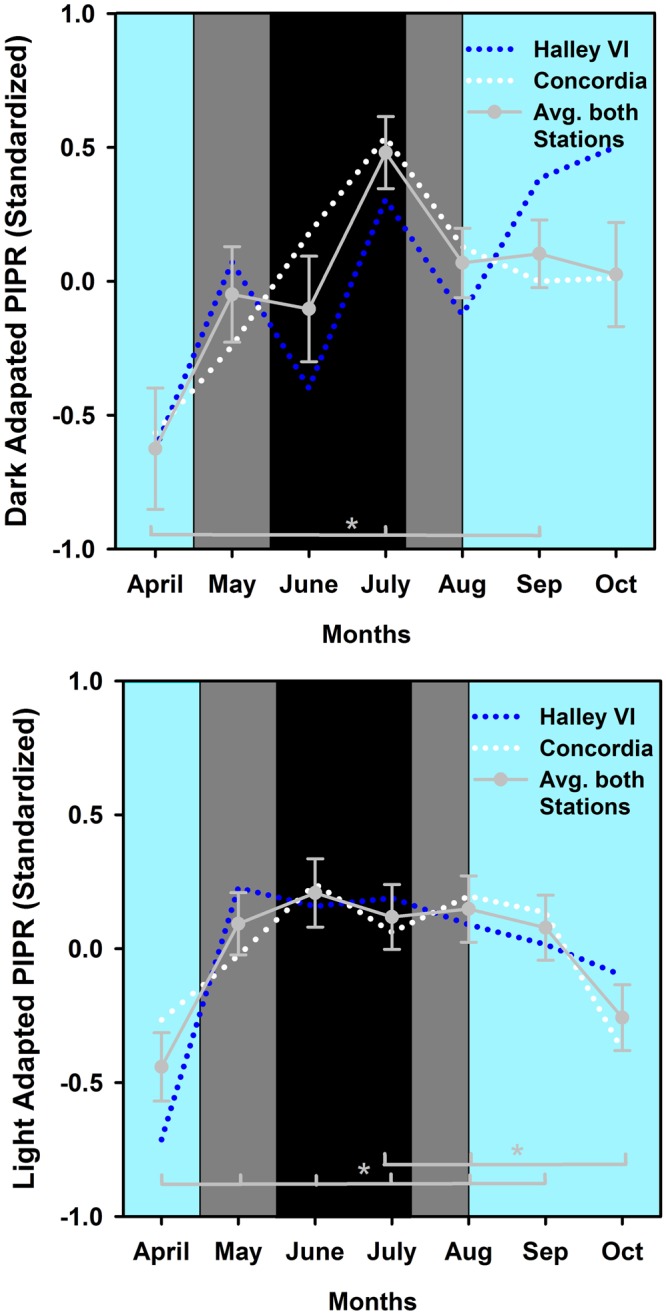
Figure 3.

(a,b) Monthly bins for dark (a) and light adapted PIPR [(b); average of both light stimuli on standardized data (z-scores)]. The data is plotted per month and the months are labeled as approximate calendar months (the data points are centered to the middle of each month). The dotted blue line represents Halley VI and the dotted white Concordia station. The solid gray line and circles indicate the average of both stations and SEM (n = 24). The cyan background indicates weeks with direct sunlight, the dark grey areas indicate weeks without direct sunlight but civil twilight and the black area shows the time without direct sunlight and without civil twilight.
