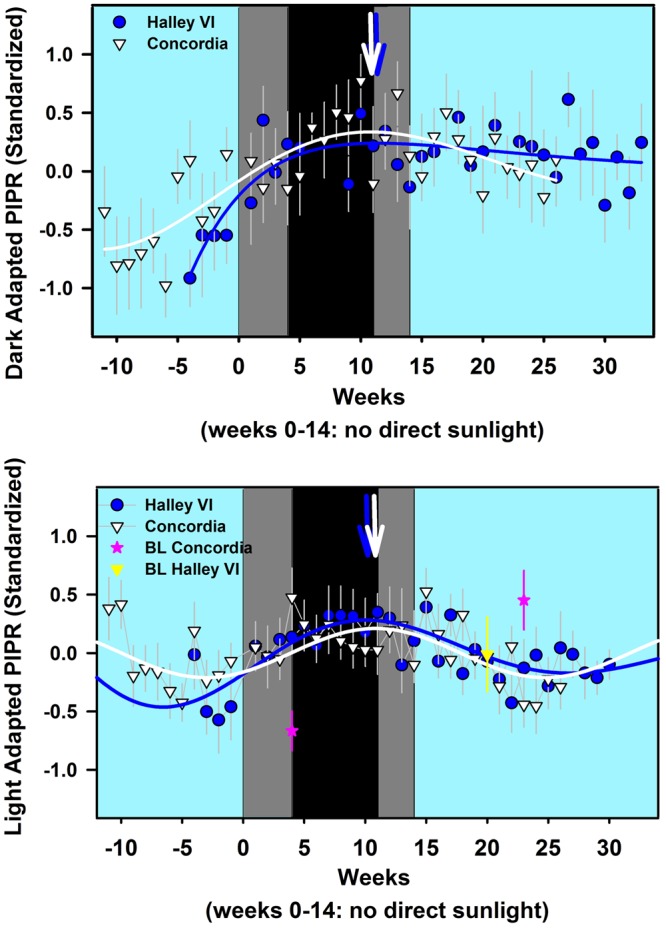
Figure 4.

(a,b) Nonlinear curve fits for dark adapted PIPR (a) and light adapted PIPR (b) across all week on standardized data (z-scores) as a function of time for both stations (Halley VI: solid blue line; Concordia: solid white line; n = 24) Blue and white symbols indicate weekly averages for both stations (± SEM). The pink stars indicate baseline values for Concordia, taken during the pre-and post mission measures and the yellow triangle indicates the pre-mission measures for Halley VI (no post-mission recordings, see methods). The blue and white arrows at the top indicate the week with the maximum PIPR (derived from fitted lines; see text for exact numbers). The cyan background indicates weeks with direct sunlight, the light grey areas indicate weeks without direct sunlight but civil twilight and the black area shows the time without direct sunlight and without civil twilight.
