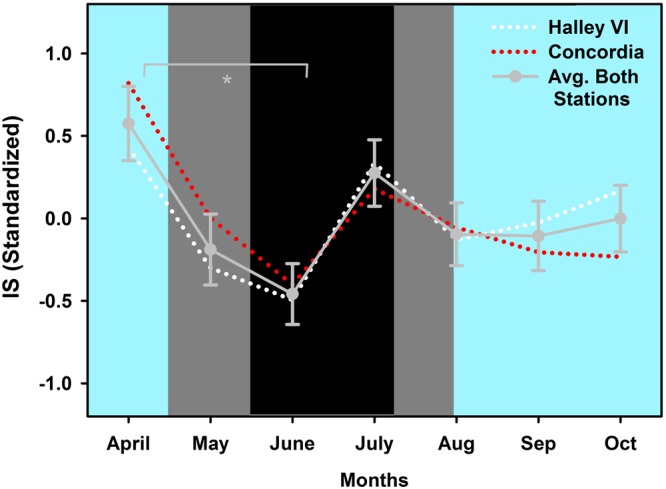
Figure 5.

Inter-daily stability for both stations on standardized data (z-scores; white dotted line: Halley VI; red dotted line: Concordia) and averaged across stations (grey solid line and grey circles; ±SEM) across 7 months. *Significant main effect of TIME between month 1 (April) and month 3 (June; p < 0.05). The cyan background indicates weeks with direct sunlight, the grey areas indicate weeks without direct sunlight but civil twilight and the black area shows the time without direct sunlight and without civil twilight.
