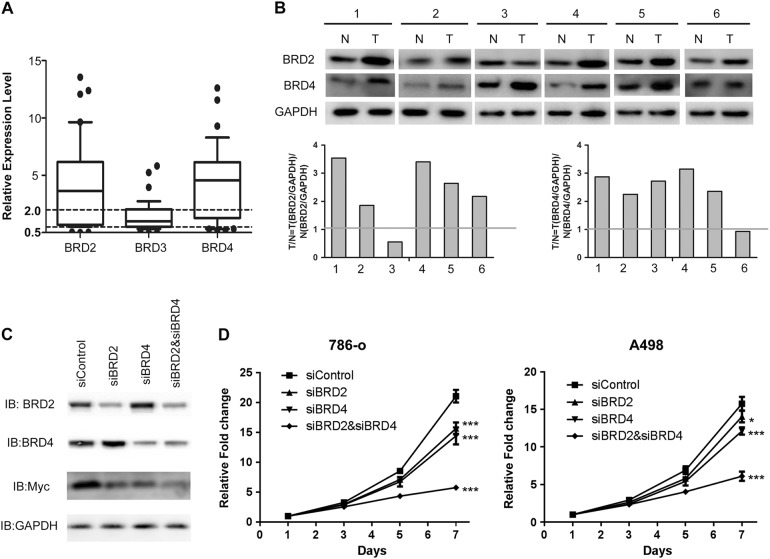
Fig. 1. Overexpression and knockdown of BET proteins in RCC.
a Quantitative real-time PCR results of relative expression levels of BRD2, BRD3, BRD4 in 39 pairs of RCC tissues and adjacent normal tissues. b Immunoblot analysis of BRD2 and BRD4 expression in 6 pairs of RCC tissues and adjacent normal tissues. Quantifications are shown in the panels below. c Knockdown efficiency of siBRD2 and BRD4 by immunoblot analysis. d Knockdown of BRD2 or BRD4 moderately inhibited the proliferation of RCC 786-O and A498 cells, while knocking down both of their expressions resulted in more significant anti-proliferative effects. Two-way ANOVA with multiple comparisons was used to compare each knocking down group to siControl group. Representative results were shown, error bars indicated standard deviation among technical replicates (n = 5 technical replicates per experiment). *p < 0.05; **p < 0.01; ***p < 0.001. The experiments were replicated 3 times to confirm the conclusion

