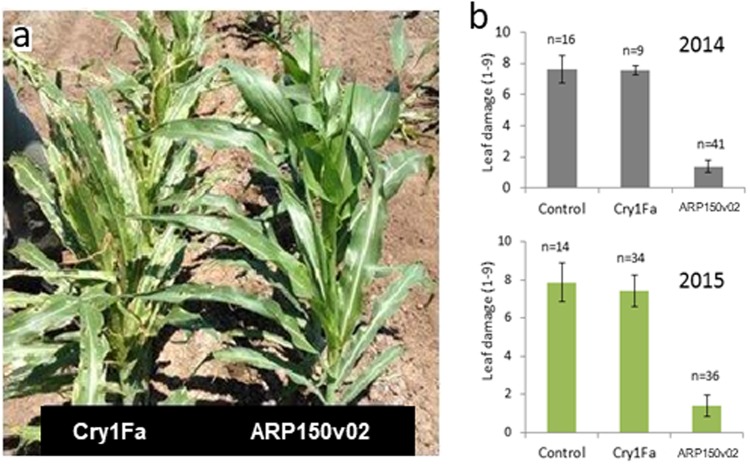
Figure 4.
Field performance of corn plants expressing ARP150v02. (a) Transgenic corn plants expressing ARP150v02 (right) compared to transgenic plants expressing Cry1Fa (left). (b) Average leaf damage scores from field-tested transgenic corn plants, on a scale from 1 to 9, where 1 means no visual damage and 9 means the leaves are almost totally destroyed. The number of transgenic events tested is indicated. Control plants were nontransgenic.

