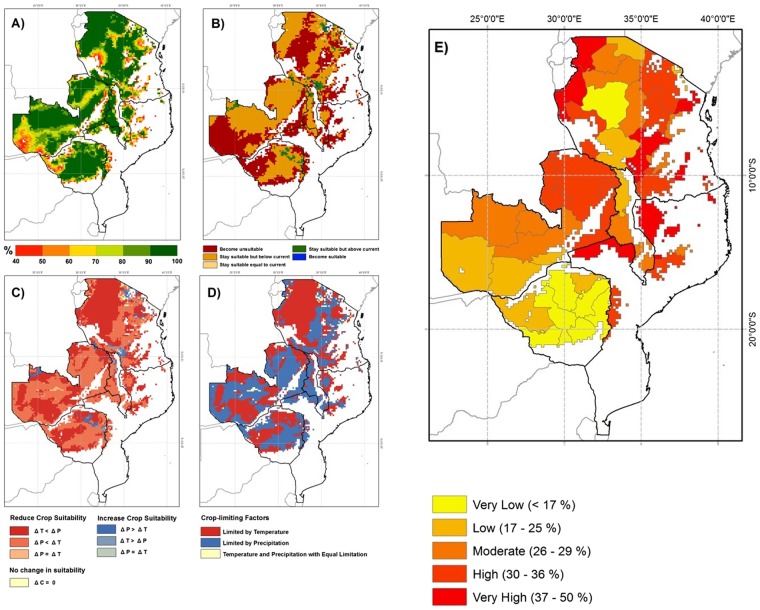
Figure 1.
Historical and future (2050) common bean suitability simulations for south-east Africa and current percentage of children underweight; (A) Suitability of currently cultivated common bean for historical climate; (B) Projected impact of climate change by 2050 s; (C) Driving factor of change in future climatic suitability; (D) factor most limiting to bean cultivation suitability by 2050; (E) Percentage of children, under the age of 5, who are underweight (data from CIESIN), for the period 1990–2002. Red (reduced suitability), blue (increased suitability), and beige (no change in suitability) colours are used in (C) to separate directions of change. In red areas, shades of red are used to differentiate areas where suitability reductions are due to temperature changes (ΔT < ΔP), from those where suitability reductions are due to precipitation changes (ΔP < ΔT) or where temperature- and precipitation- suitability reductions are equal (ΔP = ΔT). In blue areas, shades of blue are used to differentiate areas where suitability increases are primarily driven by precipitation (ΔP > ΔT), temperature (ΔT > ΔP), or equally driven by both (ΔP = ΔT).

