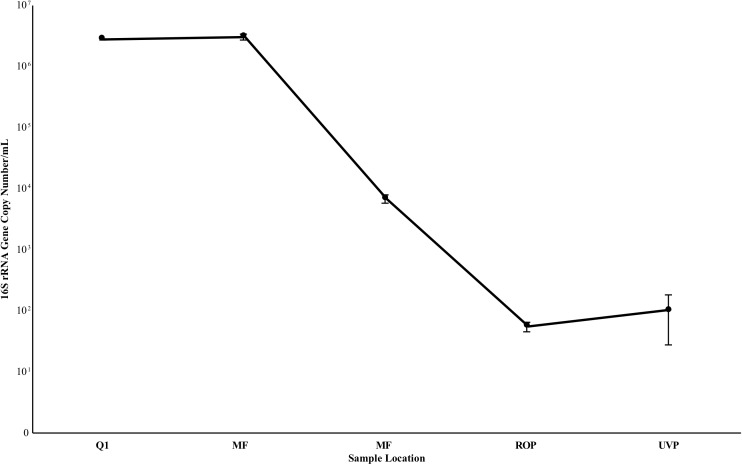
FIGURE 6.
16S rRNA gene copy estimate from samples taken in July 2017. Values are the average of triplicate biological samples and triplicate technical replicates, per biological sample. Reported deviation is the standard deviation of the above samples. Deviation at Q1 was too low to be visualized on the plot. Y axis is log scale.

