Figure 1.
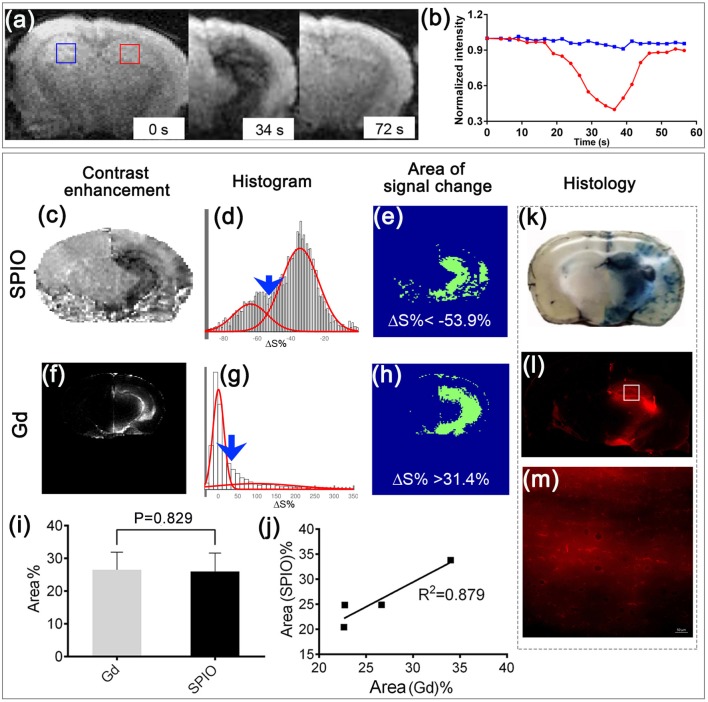
Real-time MRI to predict BBBO territory and histological validation. (a) Representative T2* images before, 34, and 72 s after infusion of SPIO at a rate of 0.15 ml/min. (b) Dynamic signal changes of the two ROIs marked in (a). (c) Contrast enhancement map at 34 s after SPIO infusion. (d) Histogram analysis of pixel intensities in (c), showing two Gaussian distributions (red lines). Blue arrow points to where a cut-off of−53.9% was applied to separate the two distributions. (e) Segmented map shows the area where the relative signal change was smaller than −53.9%. (f) Contrast enhancement map, (g) histogram analysis, and (h) segmented map (ΔS% > 31.4) at 5 min after i.p. injection of Gd. (i) Bar graph and (j) correlation analysis of the BBBO territory predicted by SPIO and that assessed using Gd (n = 4, mean ± SD). The histological analyses show the region with extravasation of Evans blue (k) and rhodamine (l, m); (m) shows the zoomed-in area indicated by the white square in (l) following mannitol injection.

