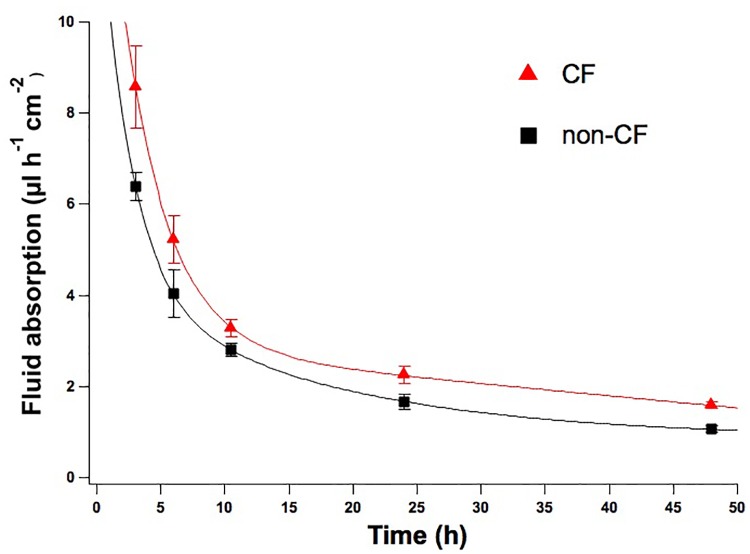
FIGURE 5.
Time course rate of fluid absorption of non-CF and CF epithelia. Net fluid absorption rate measured on non-CF (black squares) and CF (red triangles) epithelia up until 48 h of incubation with D-PBS. Mean values ± SEM are shown, at the timepoints of 24 and 48 h the differences between CF and non-CF epithelia are significant (p < 0.05).

