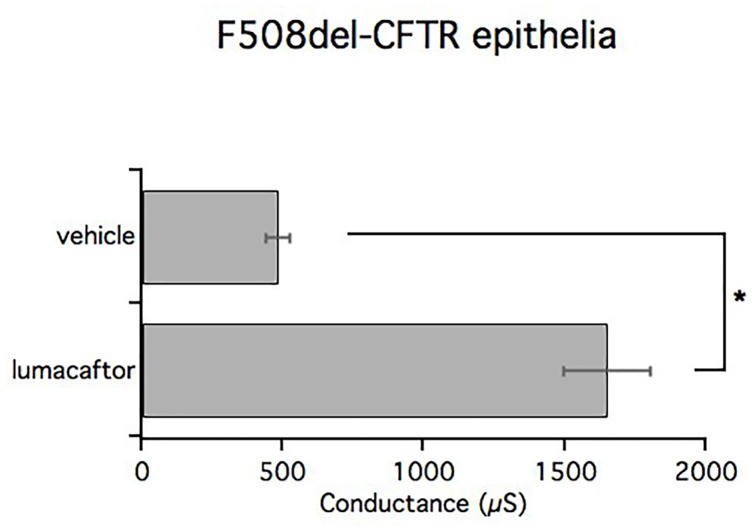
FIGURE 8.
TEER measurements in CF and lumacaftor-treated CF. Graph bars indicate TEER measurements performed on homozygous F508del-CFTR epithelia derived from 4 homozygous F508del-CFTR patients (n = 12) treated with vehicle or lumacaftor. The bar graphs show the electrical resistance values measured before and after CFTR inhibition, converted into their reciprocal conductance. Mean values ± SEM are shown, ∗ indicate p < 0.05.

