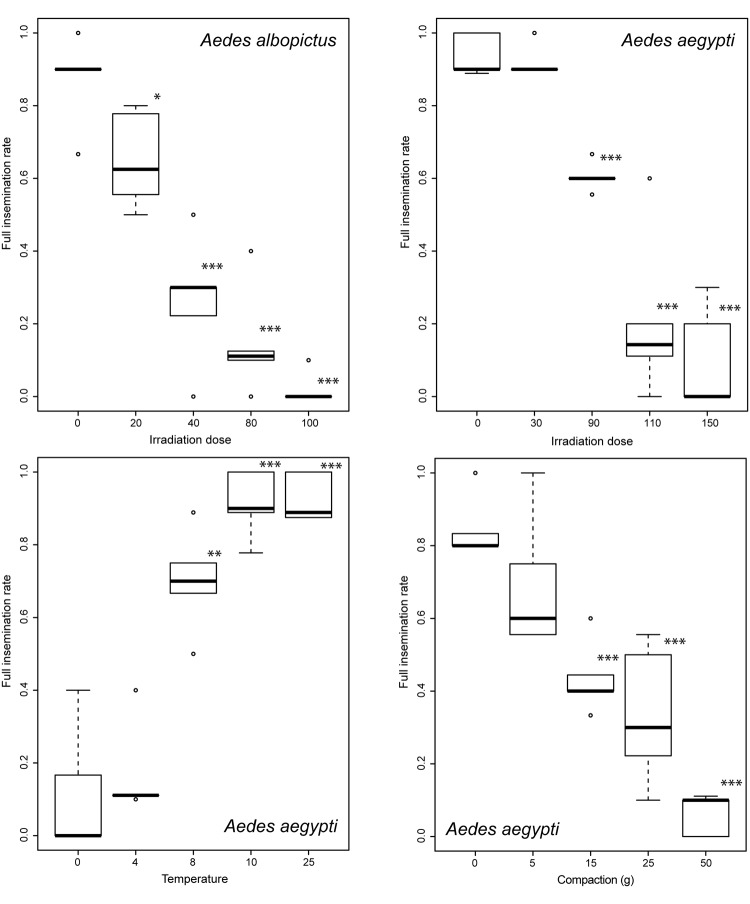
Figure 2.
Full insemination rates of male Aedes mosquitoes exposed to various treatments. The top panels present the impact of various irradiation doses on Aedes albopictus (left) and Ae. aegypti (right). The bottom panels present the impact of chilling (left) and compaction (right) on Ae. aegypti. Boxplots present the median value and the quartiles, horizontal bars the 95% percentiles and dots the minimal and maximal values. Significant differences between treatment groups and the control group are indicated (*p < 0.005, ** p < 0.01; *** p < 0.001).

