
Figure 4.
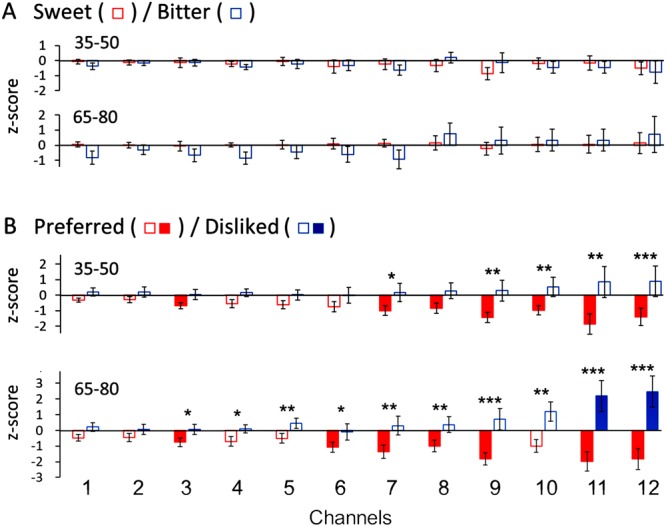
Comparison of mean z-score (±SE) during two time-windows in each channel to stimulations with sweet and bitter solutions (A) and with preferred and disliked items (B). The two time-windows are 35–50 s after the start of recording (or 15 s before swallowing) and 65–80 s (or the second 15 s after swallowing). Solid bars denote that oxyHb changes were significantly decreased or increased in comparison with the pre-stimulus resting period (P < 0.025, t-test with Bonferroni correction). Asterisks denote that oxyHb changes between preferred and disliked items are significantly different (two-way ANOVA, Tukey’s HSD test). *P < 0.05, **P < 0.01, ***P < 0.001.