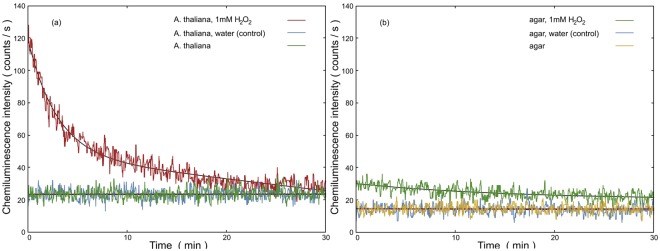
Figure 5.
(a) and (b) compare the effect of spraying 100 μL hydrogen peroxide (1 mM) and water (as a control treatment) on the chemiluminescence from A. thaliana seedlings and agar autochemiluminescence, respectively. The smooth solid lines show the best fit of the data using a polynomial function. The chemiluminescence measurement started at 30 minutes after completion of the test on the third day, and it was measured for 30 minutes using a photomultiplier detector. Samples were kept in the dark for three days before treatment and measurement. There was always a 60 s gap between injection of either H2O2 or water and the start of the measurement due to sample manipulation.

