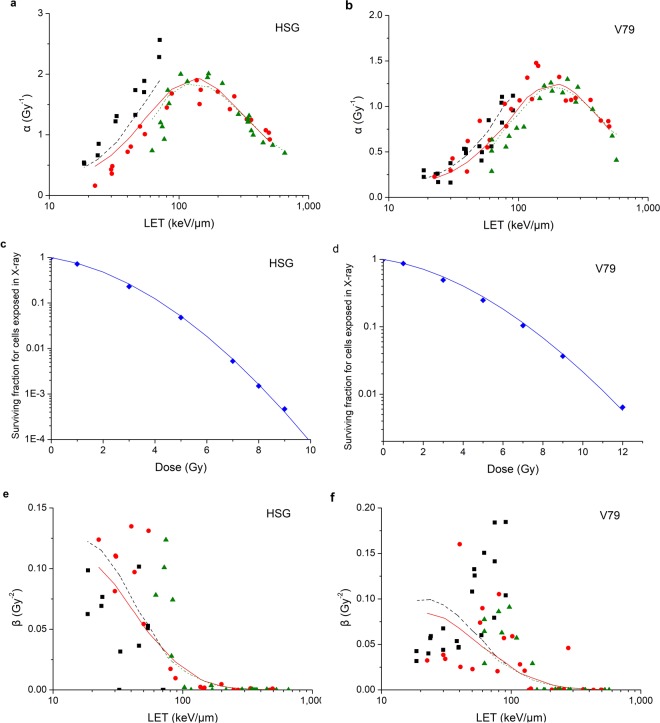
Figure 2.
Comparison between observed values from cell survival experiments (■ He-3 ion,  C-12 ion,
  Ne-20 ion,
  X-ray) and modelled values in this study (line with the same color as points) for HSG cell and V79 cell. (a) is the comparison between observed α values and modelled α values for HSG cell and (b) is for V79 cell. (c) is the survival curve for HSG cell exposed in X-ray and (d) is for V79 cell exposed in X-ray. (e) is the comparison between observed β values and modelled β values for HSG cell and (f) is for V79 cell.

