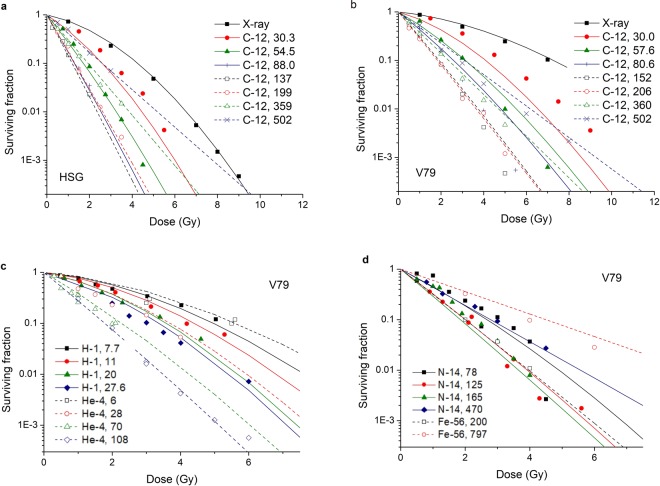
Figure 3.
Comparison between experimental data of cell surviving fractions (points) and modelled data of cell surviving fractions in this study (lines). (a) is the comparison between experimental data and modelled data for HSG cell irradiated by C-12 ion at different LET and X-ray. (b) is for V79 cell irradiated by C-12 ion at different LET and X-ray. (c) is for V79 cell irradiated by H-1 ion41,42 and He-4 ion43–45. (d) is for V79 cell irradiated by N-14 ion43,44,46 and Fe-56 ion47.

