
Figure 7.
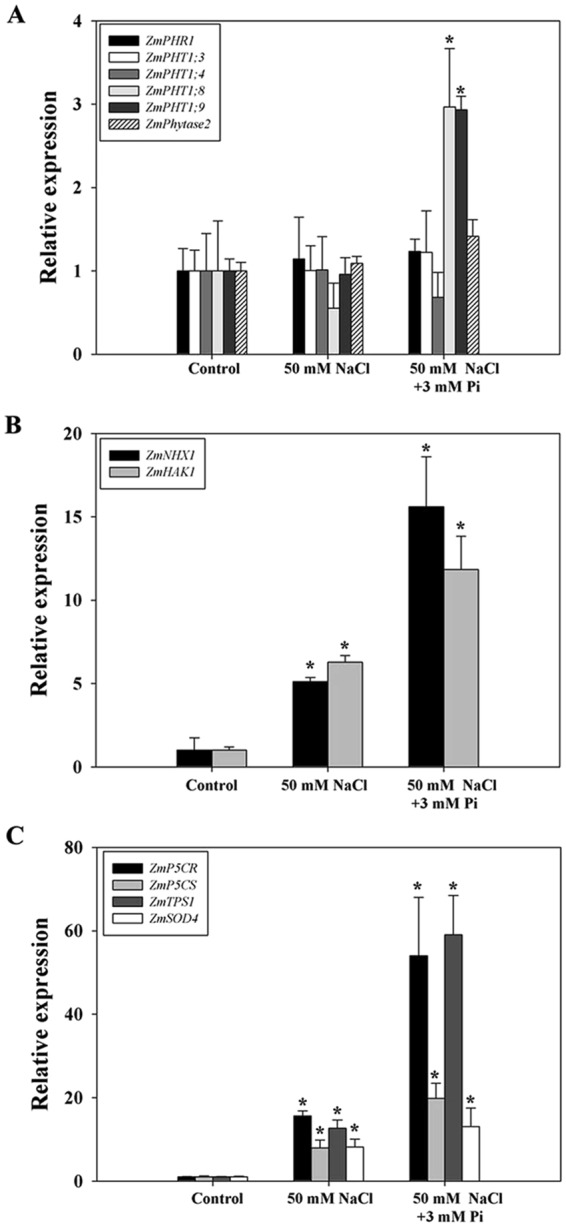
Expression analysis of ZmPHR1, ZmPHT1;3, ZmPHT1;4, ZmPHT1;8 and ZmPHT1;9 (A); ZmNHX1 and ZmHAK1 (B); and ZmP5CR, ZmP5CS, ZmTPS1 and ZmSOD4 (C) in QXN233 under NaCl with/without Pi. The values represent the means ± SEs (n = 3, *P < 0.05).
Official websites use .gov
A
.gov website belongs to an official
government organization in the United States.
Secure .gov websites use HTTPS
A lock (
) or https:// means you've safely
connected to the .gov website. Share sensitive
information only on official, secure websites.
Expression analysis of ZmPHR1, ZmPHT1;3, ZmPHT1;4, ZmPHT1;8 and ZmPHT1;9 (A); ZmNHX1 and ZmHAK1 (B); and ZmP5CR, ZmP5CS, ZmTPS1 and ZmSOD4 (C) in QXN233 under NaCl with/without Pi. The values represent the means ± SEs (n = 3, *P < 0.05).