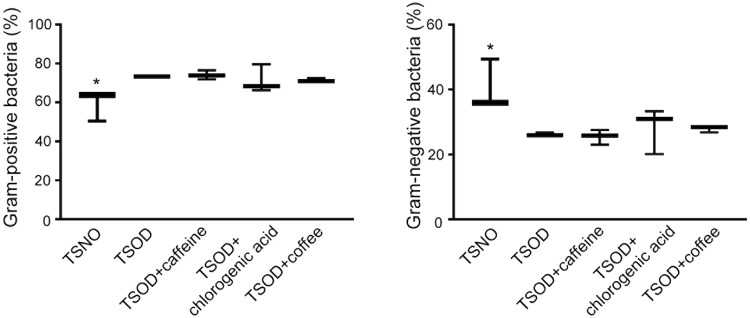
Figure 3.
Analysis of the percentages of Gram-positive bacteria and Gram-negative bacteria in 24-wk-old TSOD mice that were treated with coffee or its components and in age-matched TSNO mice. Comparison of the percentages of Gram-positive bacteria and Gram-negative bacteria. Boxes show the interquartile ranges of the first and third quartiles; medians are shown by the lines in the boxes. If no error bars are shown, the experimental error was smaller than the symbol. *FDR adjusted Q < 0.05 versus non-treated TSOD, TSOD + caffeine and TSOD + coffee mice.

