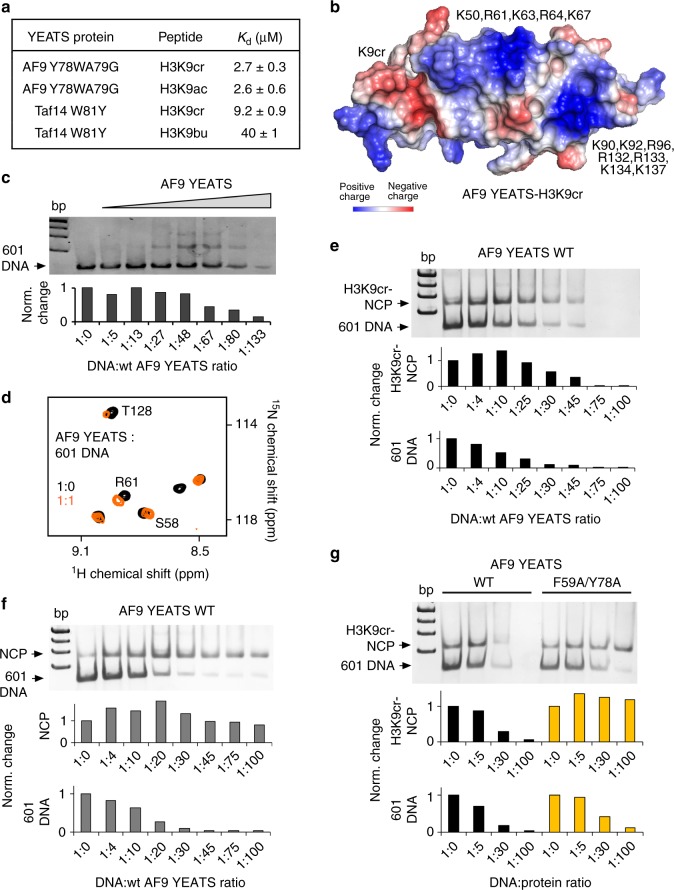
Fig. 5.
AF9-YEATS binds DNA. a Binding affinities of AF9-YEATS and Taf14-YEATS to indicated histone peptides. Values represent the average of three separate experiments with error calculated as the SD between the runs. b Electrostatic potential surface representation of the AF9-YEATS in complex with H3K9cr generated in PyMol (PDB ID 5hjb). Basic residues are labeled. c EMSA with 147-bp 601 DNA (1.88 pmol/lane) incubated with increasing amounts of AF9-YEATS. DNA to protein molar ratio is shown below the gel image. d Superimposed 1H,15N HSQC spectra of uniformly 15N-labeled AF9-YEATS collected upon titration with 601 DNA. The spectra are color coded according to the protein:DNA molar ratio. e–g EMSA assays with 1 pmol/lane H3K9cr-NCP (e, g) or unmodified NCP (f) incubated with increasing amounts of WT AF9-YEATS or F59A/Y78A mutant. Band intensities in (c, e–g) were quantified by densitometry using ImageJ

