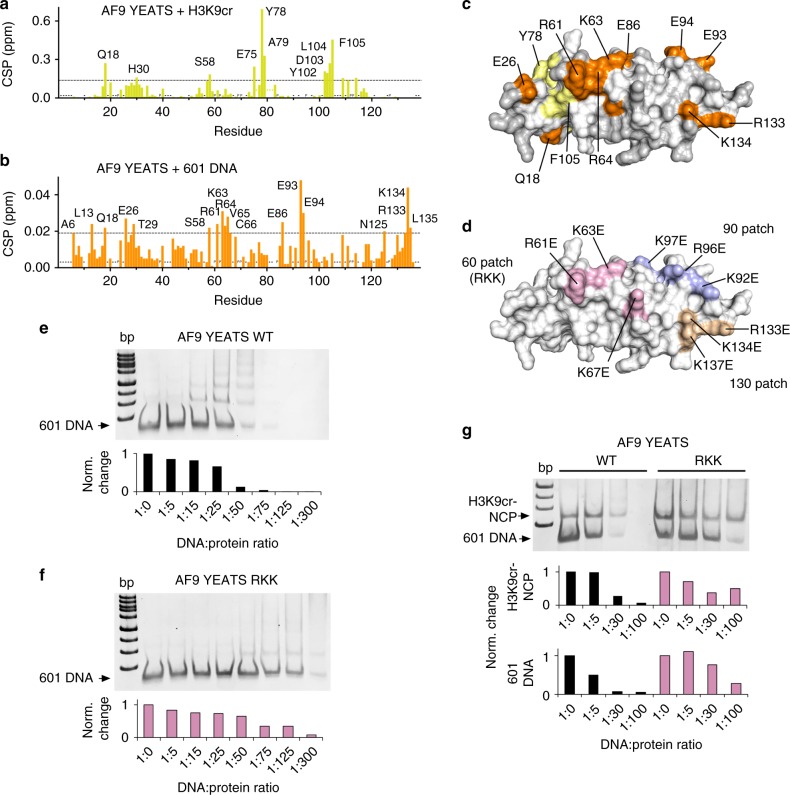
Fig. 6.
DNA- and H3K9cr-binding sites in AF9-YEATS do not overlap. a, b Analysis of chemical shift perturbations in 1H,15N HSQC spectra of AF9-YEATS caused by (a) H3K9cr peptide (1:3 molar ratio) or (b) 601 DNA (1:0.5 molar ratio). P indicates a proline residue. ‘*’ indicates that the residue resonances were unassigned in the apo-state. ‘-’ indicates that the residue resonances were unassigned in the H3K9cr-bound state (BMRB 26060). Dashed line indicates selection cut-off (mean + 3 SD). Residues with CSP above the cut-off value are labeled. c Identification of the H3K9cr peptide- and 601 DNA-binding sites. Residues with CSP above the cut-off value in (a, b) are mapped onto the surface of AF9-YEATS (PDB 5hjb), colored yellow and orange, respectively, and labeled. Residues with no assignments or prolines are colored light gray. d The 60th patch (R61K/K63E/K67E, light pink), 90th patch (K92E/R96E/K97E, light blue), and 130th patch (R133E/K134E/K137E, wheat) mutations are mapped onto the surface of AF9-YEATS. e–g EMSA assays with 1 pmol/lane 601 DNA (e, f) or 1 pmol/lane H3K9cr-NCP (g) incubated with increasing amounts of WT AF9-YEATS or RKK mutant. Band intensities were quantified by densitometry using ImageJ

