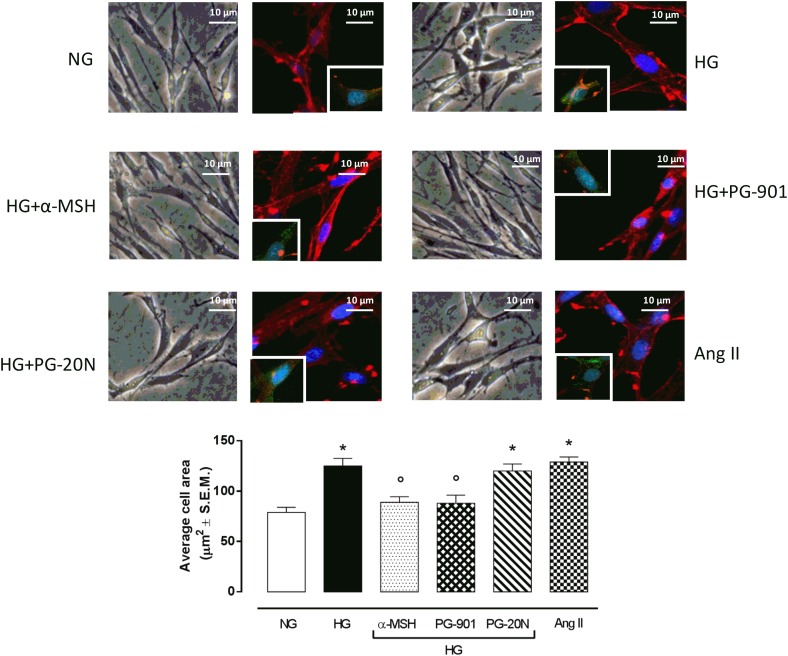
FIGURE 2.
Cell size visualization and quantization. Representative optic microscope (40X) and immunofluorescence images (40X; in blue Hoechst for nucleus and in red actin for cytoskeleton labeling) show that H9c2 cells exposed to high glucose (33 mM D-glucose) exhibited an evident increase in cell area compared to cells exposed to normal glucose (5.5 mM D-glucose). MC5R agonism with α-MSH (90 pM) and PG-901 (10-10 M) treatment significantly decreased cell area in H9c2 cells exposed to high glucose. Conversely, H9c2 cells treated with MC5R antagonist PG-20N and exposed to high glucose showed a cell area similar to HG cells. Also representative images of cell nucleus (blue), actin (red), and urotensin II receptor (anti-GPR14, green) co-localization are shown, evidencing that the increased cell area in H9c2 cells exposed to high glucose is paralleled by a high Urotensin II receptor labeling. This is decreased by α-MSH (90 pM) and PG-901 (10-10 M) treatments. Cell area was calculating by analyzing 300 cells in four different microscope fields. Values are expressed as mean ± S.E.M. of n = 9 values, obtained from the triplicates of three independent experiments. NG, normal glucose; Ang II, angiotensin II; HG, high glucose; ∗P < 0,01 vs. NG; °P < 0,01 vs. HG.

