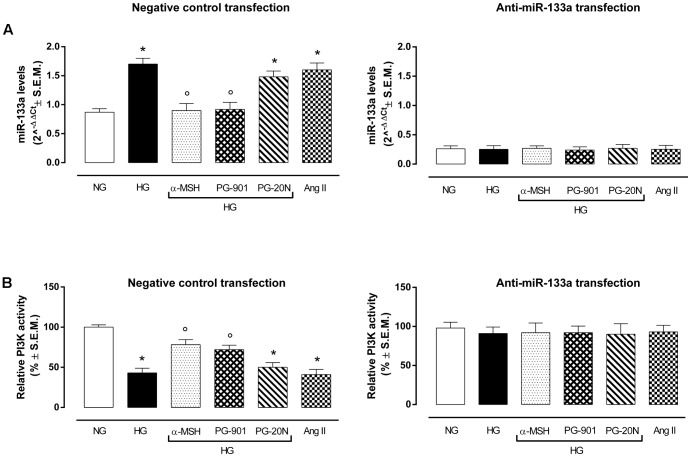
FIGURE 6.
miR-133a levels and PI3K activity. (A) H9c2 cells exposed to high glucose (33 mM D-glucose) and transfected with negative control miRNA inhibitor showed increased miR-133a levels compared to cell exposed to normal glucose (5.5 mM D-glucose). a-MSH (90 pM) and PG-901 (10-10 M) significantly decreased miR-133a levels, while PG-20N antagonist didn’t modify miR-133a expression. As expected, miR-133a knockdown abolished this differential expression pattern in our experimental setting. Values are expressed as mean of 2-ΔΔCt ± S.E.M. of n = 3 independent experiments, performing each treatment in triplicate in a single experiment. (B) Fitting with these evidences, PI3K activity was decreased in H9c2 cells exposed to high glucose, but it was significantly reverted by a-MSH (90 pM) and PG-901 (10-10 M).miR-133a knockdown reverted PI3K activity to values expressed by control cells in all the experimental conditions. Values are expressed as mean ± S.E.M. of n = 9 values, obtained from the triplicates of three independent experiments. NG, normal glucose; Ang II, angiotensin II; HG, high glucose; ∗P < 0,01 vs. NG; °P < 0,01 vs. HG.

