
Figure 5.
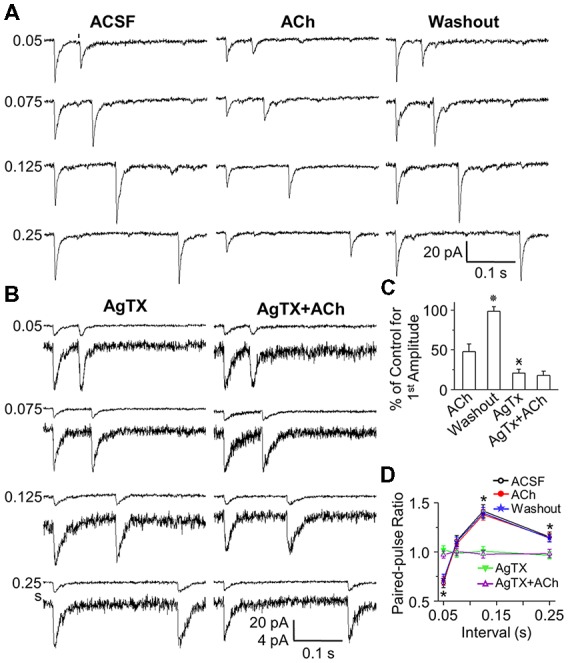
ACh reduces optical stimulation-evoked EPSC peak amplitude, but does not change STP. (A) Representative traces of paired pulse optical stimulation (arrows) evoked EPSCs at interstimulus intervals of 0.05, 0.075, 0.125 and 0.25 s (corresponding to stimulation frequencies of 20, 13.3, 8 and 4 Hz in ACSF (control), during bath application of ACh (50 μM), and after washout. (B) Representative traces of paired pulse optical stimulation evoked EPSCs in the presence of AgTX (50 nM) and AgTx (50 nM) plus ACh (50 μM). (C) Population data showing EPSC amplitude as a percentage of ACSF amplitude. (D) Population data (n = 6) showing PPR under control (open circle), in the presence of ACh (red circle), following ACh washout (star) and in the presence of AgTX (triangle) and AgTX/ACh (open triangle). The control EPSCs were similar, but they might be different from that of the test EPSC peak amplitude. The rise and the decay time were the same. For instance, at interval of 0.125 s/8 Hz, control and test rise time, decay time and peak amplitude was 1.72 ± 0.27 and 1.67 ± 0.33 ms, 10.22 ± 1.47 and 10.07 ± 1.58 ms, 96.84 ± 13.95 and 136.78 ± 16.23 pA in ACSF, and 1.61 ± 0.38 and 1.65 ± 0.43 ms, 9.36 ± 1.66 and 9.43 ± 1.72 ms, 45.42 ± 5.34 and 63.77 ± 5.94 pA in ACh. Statistical significance  P < 0.01 vs. ACh;
  P < 0.01 vs. Washout; *P < 0.01 vs. AgTx.